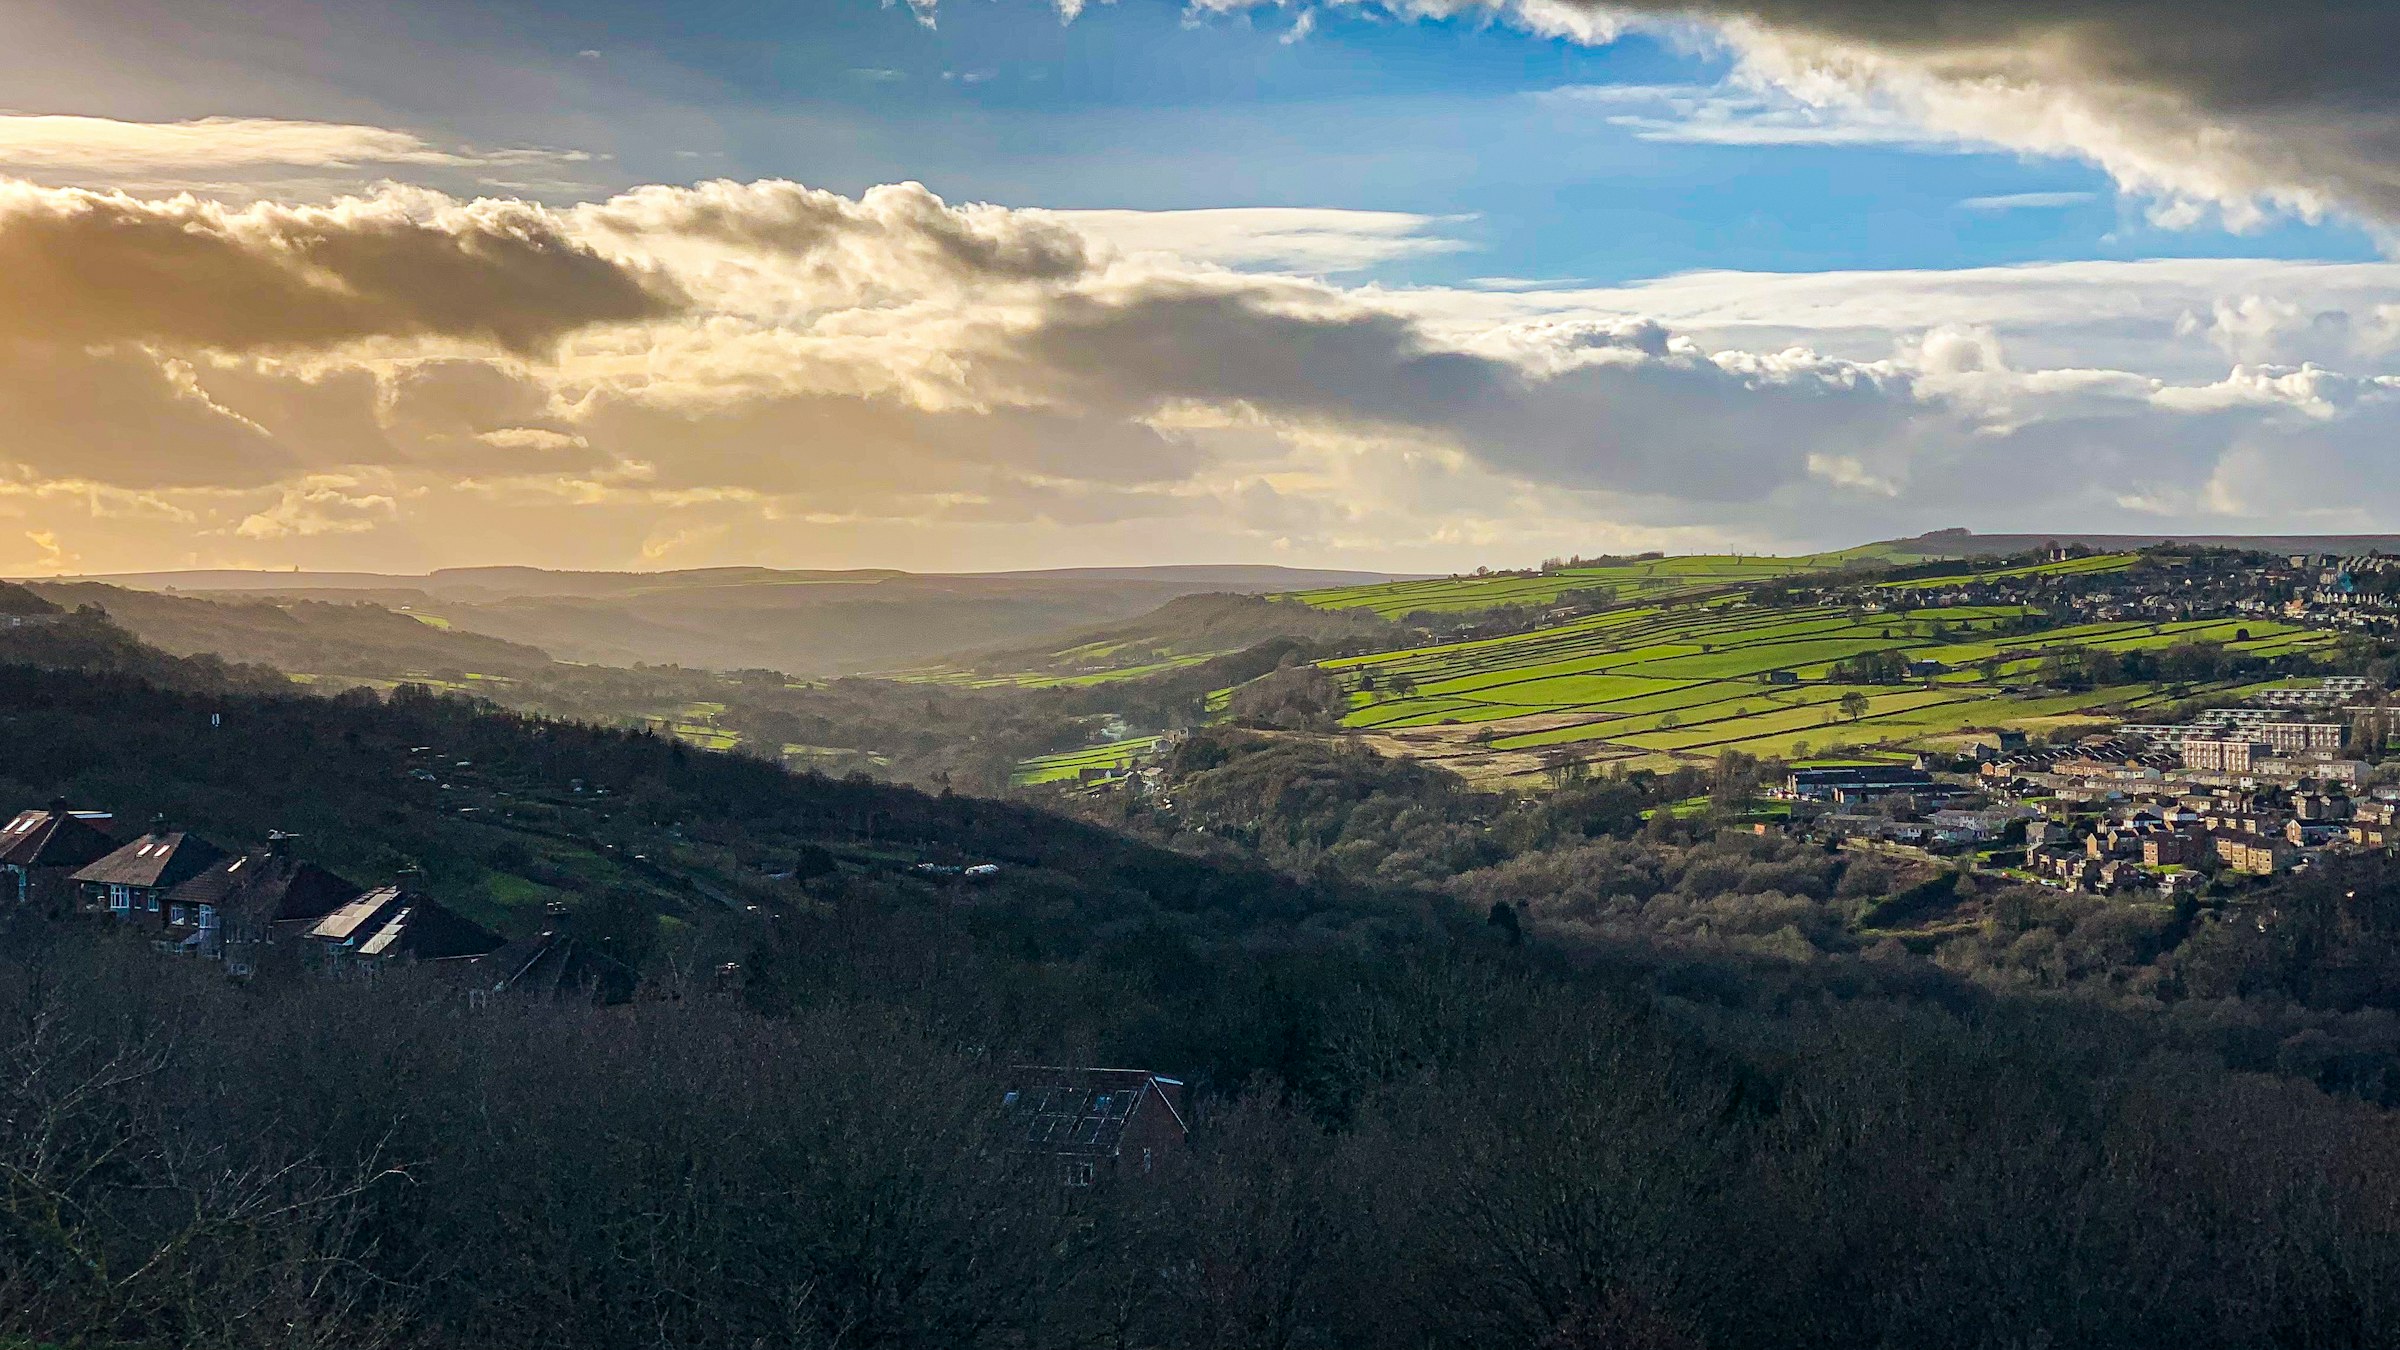
Photograph: Shane Rounce on Unsplash
All Sheffield areas · Open on the neighbourhood map
Sheffield neighbourhood
Deepcar, Sheffield
Inside the Deepcar boundary: 7 charities.
Coming up in this neighbourhood
No upcoming events are located inside this boundary yet.
Businesses and places
No directory entries are located inside this boundary yet.
Charities based here
Charity
Hillsborough Tabernacle Congregational Church – Working Funds
Religious worship. Provision of social activities – coffee mornings, boys brigade, girls brigade, bible study, room hire to community groups.
Charity
Deepcar Village Community Association
Village hall. For the the use of local group, and individuals in the Deepcar area
Charity
High Temperature Mechanical Testing Committee
To improve high temperature testing by: Providing a forum for discussion, organising conferences and laboratory visits, publishing conference proceedings and codes of practice and initiating research…
Charity
Anvil Trust
Anvil Trust offers a range of learning opportunities in applied Christian studies for people wishing to explore the faith in depth and detail. They are available…
Charity
Steel Valley Beacon Arts
SVBA is primarily a performing arts company with the remit to train and develop actors from our community.

Charity
Steelers Healers Workshop
Scorecard 1 card
How Deepcar scores
Overall 35 out of 100, ranked 127 of 147 neighbourhoods, from 6 of 7 dimensions. Each score is a percentile rank against the other neighbourhoods, not a measurement.
- 27Quiet 3 inputs
- 71Green 4 inputs
- 13Connected 5 inputs
- 52Affordable 4 inputs
- –Safe not scored
- 30Lively 4 inputs
- 19Served 7 inputs
How these scores are worked out
Each input is a percentile rank: the share of the other neighbourhoods this one is at least as good as (direction per input). A dimension is the percentile rank of the mean of its available input ranks and needs at least two inputs; the overall score is the mean of the scored dimensions. Points are placed by point-in-polygon against the Data for Action boundaries; per-head figures use Census 2021 residents for neighbourhoods with their own census areas; noise shares sample an even grid of points inside each polygon against the Defra Lden bands; distances are straight lines from the polygon centre. Deepcar covers 5.34 km² with 5,618 residents (Census 2021); noise was sampled at 101 points.
| Dimension | Input | Value | Rank | Better | Source | Licence |
|---|---|---|---|---|---|---|
| Quiet | Sampled points inside a Defra road-noise band (55 dB Lden and over) | 6.9% | 31 | lower | noise | Open Government Licence v3.0 |
| Quiet | Sampled points inside a Defra rail-noise band (55 dB Lden and over) | 0.0% | 100 | lower | noise | Open Government Licence v3.0 |
| Quiet | Daily vehicles at DfT count points inside the boundary (sum of AADT; 0 when no counted major road is inside) | 26,590 vehicles a day | 18 | lower | roads | Open Government Licence v3.0 |
| Green | Nature and green sites inside the boundary: Natural England reserves, SSSIs, ancient woodland and open access land, plus council historic parks | 1.31 per km² | 77 | higher | land, council_more | Open Government Licence v3.0 |
| Green | Council community-forestry trees planted inside the boundary | 0.56 per km² | 49 | higher | council_more | Open Government Licence v3.0 |
| Green | Recent wildlife observations inside the boundary (iNaturalist and GBIF; counts only) | 0 per km² | 75 | higher | nature | Per record: CC0, CC BY or CC BY-NC |
| Green | Playgrounds, sports pitches and dog parks on OpenStreetMap | 1.78 per 1,000 residents | 74 | higher | osm_amenities | ODbL 1.0 |
| Connected | NaPTAN bus and coach stops inside the boundary | 11.41 per km² | 22 | higher | naptan | Open Government Licence v3.0 |
| Connected | NaPTAN bus and coach stops inside the boundary | 10.86 per 1,000 residents | 94 | higher | naptan | Open Government Licence v3.0 |
| Connected | Straight-line distance from the neighbourhood centre to the nearest tram stop | 7,551 m | 2 | lower | naptan | Open Government Licence v3.0 |
| Connected | Straight-line distance from the neighbourhood centre to the nearest rail station entrance | 6,707 m | 5 | lower | naptan | Open Government Licence v3.0 |
| Connected | Premises able to get gigabit broadband (Ofcom Connected Nations) | 93.8% | 32 | higher | connectivity | Open Government Licence v3.0 |
| Affordable | Median sold price over the last twelve months (standard sales, at least five) | £189,000 | 54 | lower | pricepaid | Open Government Licence v3.0 |
| Affordable | Median sold price against the Sheffield median for the same mix of property types (1.0 = Sheffield) | 0.79 | 70 | lower | pricepaid | Open Government Licence v3.0 |
| Affordable | Median sold price of a terraced house (at least five sales) | £170,000 | 57 | lower | pricepaid | Open Government Licence v3.0 |
| Affordable | Households renting (council, other social and private), Census 2021, as a proxy for rented supply | 20.5% | 21 | higher | census_more | Open Government Licence v3.0 |
| Safe | Recorded street-level crimes over the last twelve months | – No street-level crime rows are stored. | – | lower | police | Open Government Licence v3.0 |
| Safe | Violence and sexual offences over the last twelve months | – No street-level crime rows are stored. | – | lower | police | Open Government Licence v3.0 |
| Safe | Burglaries over the last twelve months | – No street-level crime rows are stored. | – | lower | police | Open Government Licence v3.0 |
| Safe | Anti-social behaviour reports over the last twelve months | – No street-level crime rows are stored. | – | lower | police | Open Government Licence v3.0 |
| Safe | The stored police data holds neighbourhood meetings and priorities only; street-level crime counts are deliberately not stored, so no neighbourhood has a safety score yet. | |||||
| Lively | Upcoming events and classes on Sheffield Events located inside the boundary | 0 per 1,000 residents | 58 | higher | neighbourhoods | CC BY 4.0 (Sheffield Events listings inside Data for Action boundaries) |
| Lively | Businesses and places in the Sheffield Events directory located inside the boundary | 0 per 1,000 residents | 17 | higher | neighbourhoods | CC BY 4.0 (Sheffield Events listings inside Data for Action boundaries) |
| Lively | Real ale pubs on OpenStreetMap | 0 per 1,000 residents | 84 | higher | osm_amenities | ODbL 1.0 |
| Lively | Community centres on OpenStreetMap | 0.36 per 1,000 residents | 81 | higher | osm_amenities | ODbL 1.0 |
| Served | Straight-line distance from the neighbourhood centre to the nearest GP practice (NHS ODS) | 880 m | 22 | lower | nhs | Open Government Licence v3.0 |
| Served | Community pharmacies inside the boundary (NHS ODS) | 0.18 per 1,000 residents | 51 | higher | nhs | Open Government Licence v3.0 |
| Served | Open primary and all-through schools inside the boundary (Get Information about Schools) | 2.52 per 1,000 under-15s | 80 | higher | schools | Open Government Licence v3.0 |
| Served | Straight-line distance from the neighbourhood centre to the nearest library (Sheffield City Council) | 1,899 m | 12 | lower | council | Open Government Licence v3.0 |
| Served | Public defibrillators on OpenStreetMap inside the boundary | 0.94 per km² | 36 | higher | osm_amenities | ODbL 1.0 |
| Served | Public toilets inside the boundary (OpenStreetMap and the Toilet Map) | 0 per km² | 60 | higher | osm_amenities | ODbL 1.0 and CC BY 4.0 |
| Served | Electric vehicle chargers on OpenStreetMap inside the boundary | 0 per km² | 86 | higher | osm_amenities | ODbL 1.0 |
Areas like this
- Stocksbridge 41
- Wharncliffe Side 31
- Rivelin 31
- Winn Gardens 35
- Bradfield 29
Neighbourhood scorecards by Sheffield Events, CC BY 4.0, derived from Defra noise mapping, DfT traffic counts, Natural England, Sheffield City Council, iNaturalist and GBIF, OpenStreetMap contributors (ODbL), the Toilet Map, NaPTAN, Ofcom, HM Land Registry, ONS Census 2021, NHS ODS, Get Information about Schools and the Data for Action neighbourhood boundaries; each input keeps its own licence. CC BY 4.0 · All data sources · Download the scores (API)
Living here 6 cards
Census 2021
How people here live
Travel, homes, origins, faith, qualifications and health for the 5,620 residents of Deepcar, with the Sheffield figure beside each, from 4 census areas.
- Most common way to work
- Driving 58.9% Sheffield Driving 45.2%
- Owner-occupied homes
- 79.5% Sheffield 58.6%
- Households without a car
- 15.9% Sheffield 29.2%
- Born outside the UK
- 2.2% Sheffield 14.9%
- Most common answer on religion
- Christian 49.7% Sheffield No religion 43.4%
- Degree-level qualified, 16 and over
- 29.6% Sheffield 33.4%
- In very good health
- 45.7% Sheffield 46.7%
Source: Office for National Statistics, Census 2021, via Nomis, Open Government Licence v3.0. Neighbourhood figures sum the census areas whose population-weighted centres (ONS Open Geography, contains OS data © Crown copyright and database right 2026) fall inside each boundary. Census 2021 on Nomis · All data sources
Deprivation here
4 small areas (LSOAs) have their population centre inside this boundary; their average IMD 2019 decile is 6.8 (1 is most deprived, 10 least).
Deprivation: English Indices of Deprivation 2019 by LSOA (MHCLG) with ONS population-weighted centroids, Open Government Licence v3.0. Decile 1 is the most deprived tenth of England. Indices of Deprivation 2019 · ONS Open Geography Portal · All data sources
Schools here
2 open nurseries, schools and colleges whose registered position is inside this boundary, from the Department for Education register.
- Primary Deepcar St John's Church of England Junior School ages 7 to 11 · Voluntary aided school · S36 2TE Website
- Primary Royd Nursery and Infant School ages 2 to 7 · Community school · S36 2PR Website
Ofcom Connected Nations 2025
Broadband and mobile in Deepcar
2,679 premises in 18 census output areas whose population centres fall inside this boundary, as reported to Ofcom for July 2025.
Fixed broadband availability
- Gigabit-capable
- 94% Sheffield 93%
- 300 Mbit/s or faster
- 94% Sheffield 94%
- Superfast (30 Mbit/s or faster)
- 100% Sheffield 98%
- Cannot get 10 Mbit/s
- 0% Sheffield 0%
- Below the broadband USO
- 0% Sheffield 0%
Mobile signal
Mobile coverage is published for Sheffield as a whole: outdoor 4G from all four operators reaches 99.8% of premises, 5G from at least one operator 99.7%, and a good outdoor 4G or 5G signal from every operator 96.1%.
Availability means a service could be ordered at the address in July 2025; it is not a measured speed. Data edition: Ofcom Connected Nations 2025, published 19 November 2025.
Source: Ofcom Connected Nations 2025 data downloads (data for July 2025, published 19 November 2025), Ofcom copyright, reproduced under Ofcom's terms of use and the Open Government Licence v3.0. Output areas placed with ONS Open Geography lookups and population-weighted centroids, contains OS data © Crown copyright and database right 2026. Ofcom Connected Nations 2025 data · All data sources
Homes and prices
What sold in Deepcar
Completed sales registered from 27 Oct 2025 to 28 Aug 2026. 54 standard sales inside this boundary.
- Median price
- £189,000
- Middle half of sales
- £165,625 to £235,000
- Sheffield median
- £215,000
- Detached
- £320,000 13 sales
- Semi-detached
- £215,500 18 sales
- Terraced
- £170,000 21 sales
Most recent registered sales
- Aug 2026 Marsh Street Terraced £175,000
- Jul 2026 Carr Road Terraced £176,000
- Jul 2026 Fox Glen Road Semi-detached £165,000
- Jul 2026 Helliwell Lane Terraced £210,000
- Jun 2026 Haywood Lane Terraced £235,000
- Jun 2026 Orchard Street Terraced £152,500
- Jun 2026 Samuel Fox Avenue Detached £330,000
- Jun 2026 Lee Avenue Semi-detached £180,000
Contains HM Land Registry data © Crown copyright and database right 2026. This data is licensed under the Open Government Licence v3.0. Medians use standard sales only; the Land Registry’s additional category (for example buy-to-let and repossessions) is excluded. These are actual registered sales, not the mix-adjusted UK House Price Index estimate. Data is published one to two months in arrears and does not include every sale. Checked 25 Oct 2026. Price Paid Data · All data sources
Census 2021
Who lives in Deepcar
5,618 residents in 2,538 households, from 4 census areas whose population centres fall inside this boundary.
Ages
- Under 15
- 14% Sheffield 17%
- 15 to 24
- 10% Sheffield 16%
- 25 to 44
- 22% Sheffield 26%
- 45 to 64
- 30% Sheffield 24%
- 65 and over
- 23% Sheffield 17%
Homes
- Owned
- 79% Sheffield 59%
- Social rented
- 10% Sheffield 23%
- Private rented
- 11% Sheffield 19%
- One-person households
- 30% Sheffield 33%
- Detached
- 40% Sheffield 15%
- Semi-detached
- 35% Sheffield 38%
- Terraced
- 18% Sheffield 26%
- Flats
- 7% Sheffield 21%
Work and study, residents aged 16 and over
- In work
- 56% Sheffield 53%
- Full-time students
- 5% Sheffield 14%
- Retired
- 29% Sheffield 20%
- Unemployed
- 3% Sheffield 4%
Source: Office for National Statistics licensed under the Open Government Licence v.3.0. Census 2021 tables via Nomis; population-weighted centroids from ONS Open Geography, contains OS data © Crown copyright and database right 2026. Census 2021 on Nomis · All data sources
People and health 3 cards
Pharmacy hours here
The usual opening hours of the NHS pharmacies placed in this neighbourhood, from the Consolidated Pharmaceutical List. Bank holidays differ; ring ahead for anything urgent.
- Deepcar Pharmacy 271 Manchester Road S36 2RA · Thursday 09:00-18:30 · Closed, opens 09:00 today
NHS England
GP practice list sizes here
1 GP practice has its registered address in this neighbourhood, with 5,136 patients on its list in October 2026. That is -11 on the month before. Patients register where they choose, so a list is not the neighbourhood's population.
- Deepcar Medical Centre5,136 patients · -11 on the month · -1.2% on the year
Contains information from NHS England, licenced under the current version of the Open Government Licence (Open Government Licence). Checked 26 Oct 2026. Patients registered at a GP practice · All data sources
NHS services here
GP practices, pharmacies and dentists whose postcode centre is inside this boundary, from the NHS organisation register. For urgent help call 999 or 111.
- GP practice Deepcar Medical Centre 271 Manchester Road, Deepcar, Sheffield S36 2RA
- Pharmacy Deepcar Pharmacy 271 Manchester Road, Deepcar, Sheffield S36 2RA
- Dental practice Deepcar Dental Care 334 Manchester Road, Deepcar, Sheffield S36 2RH
Getting around 3 cards
Traffic counted here
1 DfT count point inside this boundary. Busiest: A616 A6102 to LA boundary with 26,590 motor vehicles a day in 2025.
- Count point A616 A6102 to LA boundary 26,590 motor vehicles a day (2025) · counted
Department for Transport STATS19
Road collisions here, 2021 to 2025
19 road collisions with someone hurt were recorded in this neighbourhood, 2021 to 2025: 0 fatal, 6 serious and 13 slight. 0 pedestrians and 1 cyclists were among the 28 people hurt.
- Collisions
- 19
- Fatal
- 0
- Serious
- 6
- Slight
- 13
- People hurt
- 28
- Pedestrians hurt
- 0
- Cyclists hurt
- 1
- 2021: 0 fatal, 0 serious, 1 slight2 hurt (pedestrians 0, cyclists 0)
- 2022: 0 fatal, 1 serious, 2 slight3 hurt (pedestrians 0, cyclists 0)
- 2023: 0 fatal, 1 serious, 2 slight6 hurt (pedestrians 0, cyclists 0)
- 2024: 0 fatal, 1 serious, 3 slight4 hurt (pedestrians 0, cyclists 0)
- 2025: 0 fatal, 3 serious, 5 slight13 hurt (pedestrians 0, cyclists 1)
Road collisions across Sheffield · On the Local Map
Road collision data from the Department for Transport (STATS19 road safety open data), Open Government Licence v3.0 Open Government Licence v3.0. Checked 12 Oct 2026. Road safety open data · All data sources
National Cycle Network
Signed cycle routes here
6.2 km of the National Cycle Network pass through this neighbourhood (Route 627).
- 1 segment Route 6276.2 km in Sheffield · 100% traffic-free · 0% lit · mostly firm unsealed
National Cycle Network data from the Walk Wheel Cycle Trust (formerly Sustrans) under the Open Government Licence v3.0. Contains Ordnance Survey data © Crown copyright and database rights 2018. Open Government Licence v3.0. Checked 26 Oct 2026. The dataset on ArcGIS · All data sources
Environment and sky 9 cards
Noise here
About 8% of this area is mapped at 55 dB or more from road traffic; the loudest band here is 70 to 75 dB, covering about 2%.
Rain and rivers here
Nearest rain gauge: Langsett, 7.6 km away. 61.4 mm of rain in the last 7 days, wettest day Saturday 24 Oct with 36.4 mm.
Protected land here
7 Natural England designations touch this area.
- Open access land Open access land Open access land · 6.6 ha
- Local Nature Reserve Wharncliffe Heath Local Nature Reserve · 48.9 ha
- Local Nature Reserve Town End Common Local Nature Reserve · 8.5 ha
- Site of Special Scientific Interest Wharncliffe Crags SSSI Site of Special Scientific Interest · 15.5 ha
- Ancient woodland Wharncliffe Woods Ancient woodland · Ancient Replanted Woodland · 11.2 ha
- Ancient woodland Wharncliffe Woods Ancient woodland · Ancient Replanted Woodland · 6.3 ha
- Ancient woodland River Don Wood West Ancient woodland · Ancient & Semi-Natural Woodland · 4.8 ha
Storm overflows here
3 monitored storm overflows inside this boundary. None is discharging now or has in the last 48 hours.
- 🟢 Not discharging River Don Not discharging · last discharge ended 25 Oct 06:56
- 🟢 Not discharging The Porter Or Little Don River Not discharging · last discharge ended 31 Aug 11:12
- 🟢 Not discharging The Porter Or Little Don River Not discharging · last discharge ended 26 Oct 13:23
British Geological Survey
The ground beneath Deepcar
At the centre of Deepcar the bedrock is the Pennine Lower Coal Measures Formation: mudstone, siltstone, sandstone, coal, ironstone and ferricrete, Carboniferous, Langsettian (Westphalian A), about 316 to 314 million years ago, on the BGS 1:625 000 bedrock map (unit PSLCM). The 1:625 000 map is a regional overview generalised from more detailed sheets: it describes the ground under a neighbourhood as a whole and is not a site investigation.
Contains British Geological Survey materials © UKRI 2026. Open Government Licence v3.0. Checked 10 Oct 2026. BGS Geology 625k bedrock · All data sources
Recorded flood outlines
Floods recorded here
The Environment Agency has mapped 4 floods reaching part of Deepcar, the earliest in 2007. The outlines show where water got to those times, not where it will go next, and floods that nobody surveyed are not recorded.
- 2019 November Flood Incident7 to 8 Nov 2019 · 1 outline · main river · obstruction or blockage: bridge
- 2007 River Don Huthwaite15 to 30 Jun 2007 · 1 outline · main river · channel capacity exceeded
- 2007 River Don Warncliffe Wood15 to 30 Jun 2007 · 1 outline · main river · channel capacity exceeded
- 2007 The Porter or River Little Don15 to 30 Jun 2007 · 1 outline · main river · channel capacity exceeded
The outlines on the Local Map · Today's river levels
Recorded Flood Outlines, © Environment Agency copyright and/or database right 2025. Open Government Licence v3.0. Checked 12 Oct 2026. Recorded Flood Outlines dataset · All data sources
Forestry Commission, National Forest Inventory
Woodland here
- Woodland
- 49.8 ha17 parcels
- Tree cover
- 9.3%of the neighbourhood
- Rank
- 55of 147 neighbourhoods for woodland cover
- Woodland near Deepcar · 16.4 ha here, 16.4 ha in allmostly broadleaved · Deepcar · 5 parcels
- Woodland near Deepcar · 11.1 ha here, 11.1 ha in allmostly conifer · Deepcar · 1 parcel
- Wharncliffe Wood · 0.6 ha here, 374.3 ha in all51% broadleaved · Wharncliffe Side, Bradfield, Ewden and Bolsterstone · 62 parcels
Sheffield's woods · On the Local Map
National Forest Inventory: © Forestry Commission copyright. Contains Ordnance Survey data © Crown copyright and database right 2026. Open Government Licence v3.0. Checked 12 Oct 2026. Dataset: National Forest Inventory England 2025 · All data sources
Ordnance Survey, OS Open Greenspace
Pitches, courts and greens here
- Allotments and community growing spaces
- 1
- Playing fields
- 1
- Golf courses
- 1
- Play spaces
- 5
- Gates and entrances
- 13
- Truman Grove Allotment Gardens · Allotment site0.2 ha · 1 entrance
Across Sheffield · On the Local Map
Contains OS data © Crown copyright and database right 2026. OS Open Greenspace, Open Government Licence v3.0. Checked 12 Oct 2026. Dataset: OS Open Greenspace, 2026-04 release · All data sources
Mining Remediation Authority
Coal mining legacy here
About 48.5% of Deepcar, roughly 257.5 hectares, lies in a coal mining Development High Risk Area: recorded shafts, adits or shallow workings are at or near the surface, so new building there needs a coal mining risk assessment.
- Land in a high risk area
- 48.5%about 257.5 hectares
- Sheffield as a whole
- 17.1%
This is a planning designation drawn from recorded features, not a survey of any one property, and being in an area does not mean the ground there is unsafe. Buying or building? Ask the authority itself. Check if a property is affected by coal mining · Coal mining risk assessments for planning · Report a coal mine hazard (24 hours)
Contains Mining Remediation Authority data, Crown copyright, Open Government Licence v3.0. Checked 26 Oct 2026. Dataset: Coal mining Development High Risk Area · All data sources
Heritage and culture 3 cards
On Wikipedia and Commons
4 Wikipedia articles, placed inside this boundary.
- Deepcar Deepcar is a village located on the eastern fringe of the town of Stocksbridge, South Yorkshire, England.
- Deepcar railway station Deepcar railway station, originally "Deep Car", is a disused railway station near Deepcar, South Yorkshire, England.
- Little Don River The Little Don River also known as the Porter, is a tributary of the River Don in South Yorkshire, England.
- Wharncliffe Crags
Landmarks and heritage
11 listed buildings, landmarks and plaques whose recorded position is inside this boundary, from Wikidata and Open Plaques.
- Listed or scheduled Barn And Farm Buildings Approximately 15 Metres To North East Of Royd Farmhouse Grade II listed building barn in Stocksbridge, Sheffield, South Yorkshire, England, UK Heritage List entry
- Listed or scheduled Barn Approximately 30 Metres To East Of Number 15 Grade II listed building barn in Stocksbridge, Sheffield, South Yorkshire, England, UK Heritage List entry
- Listed or scheduled Barn At Number 17 Grade II listed building barn in Stocksbridge, Sheffield, South Yorkshire, England, UK Heritage List entry
- Listed or scheduled Lower Townend Farmhouse, Cottage And Attached Barn Grade II listed building cottage in Stocksbridge, Sheffield, South Yorkshire, England, UK Heritage List entry
- Listed or scheduled Milepost Opposite Number 220 Approximately 200 Metres North West Of Junction With Haywood Lane Grade II listed building · since 1801 milestone in Stocksbridge, Sheffield, South Yorkshire, England, UK Photo on Commons · Heritage List entry
- Listed or scheduled Royd Farmhouse Grade II listed building farmhouse in Stocksbridge, Sheffield, South Yorkshire, England, UK Heritage List entry
- Listed or scheduled Upper Townend Farm House Grade II listed building farmhouse in Stocksbridge, Sheffield, South Yorkshire, England, UK Heritage List entry
- Listed or scheduled Iron Age and Roman quern workings on Wharncliffe Rocks scheduled ancient monument archaeological site in Stocksbridge, Sheffield, England, UK Heritage List entry
- Landmark Deepcar railway station Railway station railway station in South Yorkshire, England, UK, now closed Wikipedia · Photo on Commons
- Landmark Stocksbridge Railway ELR railway line section · since 1874 railway operating between Stocksbridge and Deepcar, in South Yorkshire, England Wikipedia
- Landmark Wharncliffe Crags Escarpment escarpment near Sheffield, South Yorkshire, England Wikipedia · Photo on Commons


Historic England
Heritage at risk here
1 site in this neighbourhood is on the 2025 Heritage at Risk Register.
- Iron Age and Roman quern workings on Wharncliffe RocksScheduled Monument · Archaeology · Deepcar · List entry 1004802 · Wikidata
Heritage at Risk Register © Historic England 2026. Contains Ordnance Survey data © Crown copyright and database right 2026. Open Government Licence v3.0. Checked 12 Oct 2026. Heritage at Risk Register · All data sources
Council and democracy 5 cards
Council data for this area
What Sheffield City Council's open data records inside this boundary.
- Trees 3 community forestry trees mostly Alnus glutinosa
- Local heritage Deepcar Mill Weir
- Local heritage Deepcar Railway Station (former)
- Local heritage Walders Low
- Polling station Deepcar Village Hall Helliwell Lane Deepcar Sheffield S36 2QH Stocksbridge & Upper Don Ward · district YB
- Polling station St John The Evangelist Church 65 Manchester Road Stocksbridge Sheffield S36 2QX Stocksbridge & Upper Don Ward · district YG
- School crossing Royd Nursery Infants CARR RD/ST MARGARET'S RD
- Litter bins 12 council litter bins on the streets here
Planning applications here
7 applications lodged in the last 12 weeks, 7 still undecided.
- UndecidedQuarry Hill Cottage Wood Royd Road Sheffield S36 2TA
- UndecidedLand Between Hollin Busk Road And Broomfield Grove And Broomfield Lane Sheffield S36 2AQ
- UndecidedLand Between Hollin Busk Road And Broomfield Grove And Broomfield Lane Sheffield S36 2AQ
- UndecidedLand Between Hollin Busk Road And Broomfield Grove And Broomfield Lane Sheffield S36 2AQ
- UndecidedLand Between Hollin Busk Road And Broomfield Grove And Broomfield Lane Sheffield S36 2AQ
- UndecidedSt Johns Vicarage 27 Carr Road Deepcar Sheffield S36 2PQ
- UndecidedClough House 74 Wood Royd Road Sheffield S36 2TA
Planning applications: UK PlanIt, aggregated from Sheffield City Council. Check the council record before relying on any detail; documents are linked, never copied. UK PlanIt · All data sources
Planning constraints
Conservation areas and brownfield land here
9 sites on the brownfield land register sit here, 32.0 hectares in all put forward for housing.
- Former Steins Tip, Station Road, Deepcar
- Former Outokumpu Steelworks off Ford Lane, North of Manchester Road, Stocksbridge
- Ernest Thorpe’s Lorry Park, Station Road, Deepcar
- Fox Valley, Sky-House, New Road Stocksbridge Sheffield S36 2EJ
- Site Of 19 Haywood Lane And 8 Ash Lane Sheffield S36 2QE
- Townend Farm Townend Lane Sheffield S36 2TS
- St John's Church Hall, St John's Road, Deepcar, Sheffield S36 2SF
- 8-10 Manchester Road Stocksbridge Sheffield S36 2RD
- And 1 more on the register. Brownfield land across Sheffield
Contains planning.data.gov.uk data published by Sheffield City Council and neighbouring planning authorities under the Open Government Licence v3.0; conservation area boundaries © Historic England, containing Ordnance Survey data © Crown copyright and database right. Open Government Licence v3.0. Checked 10 Oct 2026. planning.data.gov.uk · All data sources
Valuation Office Agency
Council tax bands here
The 4 small areas (LSOAs) whose population centres fall in this neighbourhood hold about 2,780 homes on the council tax list; 42% are in Band A, against 58% across Sheffield. The average full bill across these homes before discounts is about £2,076 a year in 2026-27, worked out from the Band D figure. A few very small counts are withheld by the VOA, so the bands add up to slightly fewer homes than the total.
| Area | Band A | Band B | Band C | Bands D to H |
|---|---|---|---|---|
| Deepcar | 42.4% | 12.9% | 27% | 17.6% |
| Sheffield | 58% | 16.3% | 12.7% | 13% |
- Homes
- 2,780
- Band A
- 42%
- Band B
- 13%
- Band C
- 27%
- Bands D to H
- 18%
- Band A: 1,180 homes (42.4%)Valued up to £40,000 in 1991 · £1,673.44 full bill, 2026-27
- Band B: 360 homes (12.9%)Valued £40,001 to £52,000 in 1991 · £1,952.35 full bill, 2026-27
- Band C: 750 homes (27.0%)Valued £52,001 to £68,000 in 1991 · £2,231.25 full bill, 2026-27
- Band D: 210 homes (7.6%)Valued £68,001 to £88,000 in 1991 · £2,510.16 full bill, 2026-27
- Band E: 230 homes (8.3%)Valued £88,001 to £120,000 in 1991 · £3,067.97 full bill, 2026-27
- Band F: 40 homes (1.4%)Valued £120,001 to £160,000 in 1991 · £3,625.79 full bill, 2026-27
- Band G: 10 homes (0.4%)Valued £160,001 to £320,000 in 1991 · £4,183.60 full bill, 2026-27
- Band H: 0 homes (0.0%)Valued over £320,000 in 1991 · £5,020.32 full bill, 2026-27
Council tax bands across Sheffield · On the Local Map
Council tax stock of properties (table CTSOP1.1) from the Valuation Office Agency, Open Government Licence v3.0 Open Government Licence v3.0. Checked 12 Oct 2026. Valuation Office council tax statistics · Background notes · All data sources
Draft Sheffield Plan
Sites the plan allocates here
2 sites in this neighbourhood are allocated in the draft Sheffield Plan, with room for 428 new homes in all. It is a draft at Main Modifications stage with a further round of changes still to settle, so sites and numbers can change. About the Sheffield Plan
- SD02 Former Steins Tip, Station Road, DeepcarStrategic Housing Site · 428 homes · 24.21 ha · brownfield
- SD01 Ernest Thorpe's Lorry Park, Land adjcent to the River Don, Station Road, S36 2UZEmployment Site · General Employment · 0.89 ha · brownfield
Site allocations: Sheffield City Council, Main Modifications Sheffield Plan Policies Map, under the Open Government Licence v3.0. Contains Ordnance Survey data © Crown copyright and database right. Checked 12 Oct 2026. Dataset: Site Allocation · All data sources
Money and energy 3 cards
National Lottery grant database
Lottery money in Stocksbridge and Upper Don ward
Awards filed to recipients in Stocksbridge and Upper Don ward, the ward this area sits in. Awards to individuals are counted in the figures and never named.
- Awards since 1995
- 118
- Awarded in total
- £2.3m
- Awards since 2022
- 19
- Awarded since 2022
- £360,251
Latest awards to organisations here
- Steelers Healers Workshop · £19,700Men in Sheds Deepcar · National Lottery Awards for All England · The National Lottery Community Fund · 9 Jul 2026
- Food Matters – Stocksbridge · £42,684Food Matters – The Stocksbridge Food Hub · RC Yorkshire and Humber Region · The National Lottery Community Fund · 21 Apr 2026
- Bolsterstone Village Hall Trust · £10,000Bolsterstone Village Hall Kitchen Refurbishment · National Lottery Awards for All England · The National Lottery Community Fund · 11 Feb 2026
Lottery money across Sheffield
National Lottery grant data from the Department for Culture, Media and Sport, Open Government Licence v3.0. Checked 28 Oct 2026. National Lottery grant database · Sheffield export (CSV) · All data sources
Office for National Statistics via Nomis
Work in this area
Deepcar sits in Stocksbridge and Upper Don ward. The claimant count is the number of people there on Universal Credit or Jobseeker's Allowance who are required to look for work, as a share of residents aged 16 to 64; the ward series begins in January 2026.
- Claimants in Stocksbridge and Upper Don ward
- 335Sep 2026
- Share of residents aged 16 to 64
- 3.0%Sep 2026
- Sheffield
- 4.4%16,785 claimants, Sep 2026
| Month | Stocksbridge and Upper Don | Sheffield |
|---|---|---|
| Jan 2026 | 2.6 % | 4.2 % |
| Feb 2026 | 2.7 % | 4.3 % |
| Mar 2026 | 2.7 % | 4.3 % |
| Apr 2026 | 2.6 % | 4.3 % |
| May 2026 | 2.6 % | 4.3 % |
| Jun 2026 | 2.6 % | 4.3 % |
| Jul 2026 | 2.6 % | 4.3 % |
| Aug 2026 | 2.8 % | 4.3 % |
| Sep 2026 | 3 % | 4.4 % |
Source: Office for National Statistics licensed under the Open Government Licence v3.0, via Nomis. Ward boundaries from ONS Open Geography, OGL v3.0. Checked 26 Oct 2026. Claimant count on Nomis · Nomis · All data sources
Sheffield City Council business rates
Rated business premises here
126 premises in Deepcar are on the business rates list, with a combined rateable value of £1,200,540.
- Rated premises
- 126
- Total rateable value
- £1,200,540
- Middle rateable value
- £5,900
- Shops and retail
- 18
- Offices
- 21
- Workshops, warehouses and industry
- 61
- Pubs, restaurants, cafes and hotels
- 6
Commonest kinds
- Workshop And Premises27 premises
- Offices And Premises21 premises
- Business Unit And Premises17 premises
- Shop And Premises13 premises
- Land Used For Storage And Premises6 premises
Streets with the most premises
- Station Road, S3637 rated premises
- Wortley Road, S3632 rated premises
- Manchester Road, S3627 rated premises
- Lee Avenue, S366 rated premises
- Helliwell Lane, S363 rated premises
- Station Road Deepcar, S363 rated premises
Highest rateable values here
- Showhouses 3, 5 & 7, And Sales & Marketing Suites, Wantley Avenue, S36 2BRShow Houses, Sales Office & Marketing · rateable value £69,500 · rates paid by Bloor Homes Ltd
- Deepcar Service Station Ltd, Manchester Road, S36 2REPetrol Filling Station And Premises · rateable value £67,500 · rates paid by Ascona Retail Limited
- Advanced Minerals Ltd, Wharncliffe Works, Station Road, S36 2UZWorkshop And Premises · rateable value £43,750 · rates paid by Advanced Minerals Ltd
- Trailer Park, Station Road, S36 2SQLand Used For Storage And Premises · rateable value £37,000 · rates paid by Ernest Thorpe And Co Ltd
- St Margarets Avenue, S36 2TESchool And Premises · rateable value £36,250 · rates paid by Deepcar St Johns C Of E Jun School
Business premises across Sheffield · On the Local Map
Business rates public dataset from Sheffield City Council via Data Mill North, Open Government Licence v3. Checked 12 Oct 2026. Business rates on Data Mill North · All data sources
Sport and facilities 1 card
Somewhere to play here
2 sites inside this boundary, with 3 facilities between them.
- Deepcar St Johns Ce Junior School 2 × Grass Pitches · Voluntary Aided School
- Stocksbridge and District Golf Club Golf · Sports Club
Community 3 cards
Around here
32 everyday places mapped inside this boundary by OpenStreetMap volunteers and the Toilet Map.
- 8 post boxes
- 6 playgrounds
- 5 defibrillators
- 5 outdoor fitness stations
- 4 sports pitches
- 2 community centres
- 1 cycle parking
- 1 memorial
- Nearest defibrillator Defibrillator 420 m away from the centre of the area
- Nearest toilets Toilets 1.7 km away from the centre of the area
- Nearest drinking water Drinking water 1.7 km away from the centre of the area
- Nearest cycle parking Cycle parking 870 m away from the centre of the area
- Nearest ev charger EV charger 1.6 km away from the centre of the area
Co-operatives UK open data
Co-operatives and societies registered here
1 co-operative, society or community business on the Co-operatives UK register gives a postcode in this neighbourhood.
- Lowood Club · DeepcarSociety · Social clubs · founded 1947 · Stocksbridge and Upper Don
Co-operative register and economy data from Co-operatives UK open data, ODC-By v1.0. Checked 12 Oct 2026. Co-operatives UK open data · All data sources
Ofsted management information
School inspections near here
The newest Ofsted inspection of each of 2 state-funded schools and colleges registered inside this boundary, as at 30 Sep 2026, with any earlier inspection Ofsted still lists.
- Primary Deepcar St John's Church of England Junior SchoolGraded inspection: Good · inspected 4 Jun 2024, published 8 Sep 2024
- Primary Royd Nursery and Infant SchoolGraded inspection, no overall grade: quality of education good · inspected 15 Oct 2024, published 20 Nov 2024Earlier: ungraded inspection 8 Jan 2020: School remains Good
School inspections across Sheffield · Schools here on the Local Map
Inspection outcomes from Ofsted management information on state-funded schools and further education and skills providers, Open Government Licence v3.0. Checked 26 Oct 2026. School inspection management information · FE and skills management information · All data sources
Charts 1 card
In numbers
Deepcar in numbers
The same census and Land Registry figures shown above, drawn so the shape is easier to see, and set against every other Sheffield neighbourhood. Hover or tab to a bar for its value; every chart has its data as a table.
Ages
Homes
| Area | Owned | Social rented | Private rented |
|---|---|---|---|
| Deepcar | 79.5% | 9.7% | 10.8% |
| Sheffield | 58.6% | 22.6% | 18.8% |
| Area | Detached | Semi-detached | Terraced | Flats |
|---|---|---|---|---|
| Deepcar | 39.8% | 35.3% | 17.8% | 7.1% |
| Sheffield | 15% | 38% | 26% | 21% |
Sold prices by month
| Month | Sales | Median price |
|---|---|---|
| Nov 25 | 5 | £332,000 |
| Dec 25 | 6 | £172,500 |
| Jan 26 | 5 | £145,000 |
| Feb 26 | 7 | £205,000 |
| Mar 26 | 8 | £193,500 |
| Apr 26 | 4 | £196,750 |
| May 26 | 10 | £212,500 |
| Jun 26 | 5 | £230,000 |
| Jul 26 | 3 | £176,000 |
| Aug 26 | 1 | too few |
| Area | Lower quartile | Median | Upper quartile | Sales |
|---|---|---|---|---|
| Deepcar | £165,625 | £189,000 | £235,000 | 54 |
| Sheffield | £161,875 | £215,000 | £300,000 | 4,388 |
How this neighbourhood compares
Each measure is compared across the 126 Sheffield neighbourhoods that have their own census area; r is the correlation from -1 to 1. A pattern across neighbourhoods is not a cause, and it says nothing about any one street or household.
Full-time students and private renting
Deepcar ranks 102nd of 126 for full-time students (5.2%) and 78th of 126 for private renting (10.8%). Across 126 neighbourhoods there is a strong link between full-time students and private renting (r = 0.85): the two rise together. Student areas are let by the room and by the year, so a high student share usually means a high private-renting share.
| Neighbourhood | Full-time students | Private renting |
|---|---|---|
| Stocksbridge | 4.8% | 13% |
| Deepcar | 5.2% | 10.8% |
| High Green | 5.2% | 10.1% |
| Burncross | 3.3% | 7.6% |
| Chapeltown | 4.5% | 10.9% |
| Grenoside | 3.7% | 7.9% |
| Ecclesfield | 4.7% | 14.2% |
| Colley | 6.5% | 8.4% |
| Shiregreen | 7.2% | 12.1% |
| Worral | 5.3% | 4.9% |
| Wharncliffe Side | 7.8% | 8.9% |
| Oughtibridge | 5.3% | 9.8% |
| Middlewood | 6.2% | 14.7% |
| Foxhill | 5.6% | 13.4% |
| Parson Cross | 7.1% | 9.3% |
| Firth Park | 11.1% | 19.2% |
| Sheffield Lane Top | 9% | 11.1% |
| Birley Carr | 5.3% | 15.4% |
| Southey | 7.9% | 11.3% |
| Wadsley Bridge | 4.1% | 18.3% |
| Longley | 8.3% | 11.7% |
| Wincobank | 6.3% | 17.3% |
| Brightside | 9.7% | 15.7% |
| Grimesthorpe | 7.5% | 32.4% |
| Wadsley | 6% | 10.8% |
| Hillsborough | 5.7% | 25.6% |
| Winn Gardens | 9.8% | 20.9% |
| Owlerton | 6.1% | 36.3% |
| Tinsley | 11.2% | 29.9% |
| Darnall | 12.1% | 20.2% |
| Pitsmoor | 11.6% | 29.6% |
| Firshill | 10.6% | 10.5% |
| Shirecliffe | 7.3% | 11.9% |
| Osgathorpe | 11.5% | 18.4% |
| Fir Vale | 14.1% | 35.7% |
| Wisewood | 5.6% | 8.4% |
| Malin Bridge | 6% | 20.8% |
| Burngreave | 14.4% | 18.6% |
| Page Hall | 11.6% | 38% |
| Wicker | 14.4% | 57.5% |
| Stannington West | 5.2% | 6.7% |
| Loxley | 4.8% | 6.7% |
| Stannington East and Deer Park | 5% | 6.2% |
| Walkley | 8.9% | 26.8% |
| Crookes | 24.3% | 34.6% |
| Rivelin | 5.9% | 8.8% |
| Upperthorpe | 16.2% | 30% |
| Netherthorpe | 64.3% | 53.6% |
| Crookesmoor | 57.3% | 51.4% |
| Tapton | 10.8% | 21.7% |
| Broomhill | 50.1% | 51.1% |
| Handsworth | 5.5% | 12.8% |
| Littledale | 9.2% | 17.7% |
| Crosspool | 6.5% | 8.8% |
| Sandygate | 5.4% | 10.9% |
| Endcliffe | 64.5% | 30.2% |
| Hunters Bar | 35.7% | 48.2% |
| Broomhall | 57.9% | 48.4% |
| Ranmoor | 7.5% | 25.3% |
| Nether Green | 7.2% | 21.6% |
| Woodthorpe | 8.9% | 15.3% |
| Manor | 7.5% | 16.6% |
| Sharrow | 44.1% | 50.1% |
| Sharrow Vale | 36% | 56.3% |
| Little Sheffield | 47.1% | 35.9% |
| Lodge Moor | 7.4% | 7.4% |
| Fulwood | 6.2% | 8.5% |
| Lowfield | 24.7% | 54.6% |
| Highfield | 61.8% | 54% |
| Nether Edge | 11.2% | 30.6% |
| Cultural Industries Quarter | 79.3% | 82.1% |
| Norfolk Park | 13.1% | 28.1% |
| Arbourthorne | 7.6% | 10.7% |
| Heeley | 7.4% | 17.3% |
| Woodhouse | 5.4% | 10.6% |
| Richmond | 5.6% | 9.8% |
| Intake | 4.8% | 13.8% |
| Carterknowle | 7.6% | 18.6% |
| Ecclesall | 6.2% | 4.2% |
| Greystones | 8.6% | 14.6% |
| Banner Cross | 11.7% | 31.6% |
| High Storrs | 5.6% | 3.9% |
| Hurlfield | 6.1% | 8.9% |
| Newfield Green | 8.8% | 8.1% |
| Gleadless Townend | 4.1% | 12.9% |
| Meersbrook | 6.4% | 26% |
| Gleadless | 6.3% | 11.2% |
| Parkhead | 6.7% | 5.4% |
| Millhouses | 6.5% | 7.6% |
| Bents Green | 6.2% | 8.3% |
| Beighton | 4.5% | 13.7% |
| Hackenthorpe | 4% | 9.8% |
| Woodseats | 5.5% | 23.7% |
| Herdings | 5.7% | 10.8% |
| Hemsworth | 7.6% | 12.4% |
| Owlthorpe | 5.6% | 7.8% |
| Charnock | 5.2% | 9.9% |
| Base Green | 6.9% | 12.7% |
| Sothall | 4.6% | 10.2% |
| Norton Lees | 4% | 8.2% |
| Meadowhead | 5.6% | 5.6% |
| Norton | 6.6% | 12.8% |
| Westfield | 5.9% | 9.3% |
| Waterthorpe | 3.1% | 10.1% |
| Halfway | 5% | 12.1% |
| Greenhill | 5.1% | 7.4% |
| Beauchief | 5.2% | 7% |
| Dore | 5.1% | 8.3% |
| Totley | 6% | 10.2% |
| Whirlow | 6.8% | 4.8% |
| Lowedges | 7.9% | 14% |
| Jordanthorpe | 7.3% | 9.8% |
| Batemoor | 8.4% | 11.9% |
| Bradway | 6.4% | 6.1% |
| Mosborough | 6.2% | 11.3% |
| Saint Vincent's and Shalesmoor | 64.5% | 69.4% |
| Neepsend | 29.3% | 64.7% |
| Cathedral Quarter | 44.6% | 73.4% |
| City Centre | 55% | 69.5% |
| Devonshire Quarter | 67.3% | 72.6% |
| Wybourn | 7% | 10.2% |
| Park Hill | 29.3% | 33.8% |
| Hyde Park | 12.1% | 9.8% |
| Frecheville | 4% | 10.5% |
| Birley | 5% | 12.8% |
| Birley Spa | 5.4% | 10% |
Median sold price and owner occupation
Deepcar ranks 67th of 120 for median sold price (£189k) and 27th of 120 for owner occupation (79.5%). Across 120 neighbourhoods there is a moderate link between median sold price and owner occupation (r = 0.67): the two rise together. Where more homes are owned outright or with a mortgage, sold prices tend to be higher; renting-heavy areas cluster lower.
| Neighbourhood | Median sold price | Owner occupation |
|---|---|---|
| Stocksbridge | £183k | 71.5% |
| Deepcar | £189k | 79.5% |
| High Green | £203k | 71.7% |
| Burncross | £270k | 90.6% |
| Chapeltown | £217k | 78.7% |
| Grenoside | £288k | 86.3% |
| Ecclesfield | £200k | 66.9% |
| Colley | £208k | 60.3% |
| Shiregreen | £145k | 41% |
| Worral | £463k | 90.1% |
| Wharncliffe Side | £260k | 69.2% |
| Oughtibridge | £265k | 79.1% |
| Middlewood | £208k | 71.5% |
| Foxhill | £169k | 54.7% |
| Parson Cross | £177k | 40% |
| Firth Park | £160k | 41.6% |
| Sheffield Lane Top | £165k | 42.3% |
| Birley Carr | £155k | 80.5% |
| Southey | £136k | 37.9% |
| Wadsley Bridge | £171k | 47.9% |
| Longley | £137k | 34.1% |
| Wincobank | £155k | 67.5% |
| Grimesthorpe | £132k | 54.3% |
| Wadsley | £245k | 69.3% |
| Hillsborough | £220k | 60.6% |
| Owlerton | £150k | 55% |
| Tinsley | £84k | 55.4% |
| Darnall | £147k | 47.3% |
| Pitsmoor | £144k | 49.4% |
| Firshill | £90k | 40.9% |
| Shirecliffe | £155k | 35.6% |
| Osgathorpe | £73k | 41.7% |
| Fir Vale | £111k | 51.7% |
| Wisewood | £244k | 65.3% |
| Malin Bridge | £213k | 72.2% |
| Page Hall | £79k | 42.5% |
| Wicker | £84k | 16.4% |
| Stannington West | £300k | 82.9% |
| Loxley | £380k | 79.8% |
| Stannington East and Deer Park | £265k | 65.7% |
| Walkley | £240k | 65.7% |
| Crookes | £267k | 57.4% |
| Rivelin | £263k | 77.5% |
| Upperthorpe | £240k | 17.8% |
| Netherthorpe | £108k | 8.7% |
| Crookesmoor | £221k | 32.4% |
| Tapton | £209k | 71.6% |
| Broomhill | £280k | 41.4% |
| Handsworth | £208k | 73.6% |
| Littledale | £148k | 56.4% |
| Crosspool | £370k | 89.5% |
| Sandygate | £373k | 70.7% |
| Endcliffe | £306k | 65.3% |
| Hunters Bar | £335k | 48.3% |
| Broomhall | £171k | 20.9% |
| Ranmoor | £514k | 69.1% |
| Nether Green | £339k | 72% |
| Woodthorpe | £163k | 35.3% |
| Manor | £166k | 39.3% |
| Sharrow | £210k | 24% |
| Sharrow Vale | £325k | 39.8% |
| Lodge Moor | £450k | 90% |
| Fulwood | £545k | 90.3% |
| Lowfield | £118k | 34.7% |
| Highfield | £170k | 23.5% |
| Nether Edge | £253k | 62.3% |
| Cultural Industries Quarter | £109k | 9.7% |
| Norfolk Park | £222k | 43.8% |
| Arbourthorne | £133k | 33% |
| Heeley | £200k | 52.4% |
| Woodhouse | £190k | 54.8% |
| Richmond | £163k | 49.4% |
| Intake | £175k | 68.6% |
| Carterknowle | £335k | 78.6% |
| Ecclesall | £315k | 94.3% |
| Greystones | £329k | 82.3% |
| Banner Cross | £296k | 67.1% |
| High Storrs | £423k | 95.6% |
| Hurlfield | £175k | 59.6% |
| Newfield Green | £133k | 26.5% |
| Gleadless Townend | £183k | 79.6% |
| Meersbrook | £250k | 70.5% |
| Gleadless | £150k | 65% |
| Parkhead | £610k | 93.5% |
| Millhouses | £385k | 89.7% |
| Bents Green | £453k | 86.8% |
| Beighton | £195k | 66.1% |
| Hackenthorpe | £190k | 72.3% |
| Woodseats | £228k | 70.5% |
| Herdings | £130k | 38% |
| Hemsworth | £136k | 40.8% |
| Owlthorpe | £300k | 75.7% |
| Charnock | £223k | 81.3% |
| Base Green | £186k | 47.7% |
| Sothall | £230k | 89.3% |
| Norton Lees | £258k | 83.1% |
| Meadowhead | £345k | 81.2% |
| Norton | £400k | 71.9% |
| Westfield | £150k | 44.7% |
| Waterthorpe | £168k | 73.2% |
| Halfway | £236k | 76.3% |
| Greenhill | £324k | 80.8% |
| Beauchief | £424k | 81.5% |
| Dore | £575k | 86.7% |
| Totley | £440k | 77.3% |
| Whirlow | £658k | 92.9% |
| Lowedges | £150k | 31% |
| Jordanthorpe | £150k | 35.4% |
| Bradway | £425k | 87.6% |
| Mosborough | £248k | 79% |
| Saint Vincent's and Shalesmoor | £90k | 19.1% |
| Neepsend | £164k | 17.3% |
| Cathedral Quarter | £107k | 20.1% |
| City Centre | £130k | 13% |
| Devonshire Quarter | £111k | 13% |
| Wybourn | £163k | 30.9% |
| Park Hill | £219k | 32.4% |
| Frecheville | £183k | 84.2% |
| Birley | £183k | 65.5% |
| Birley Spa | £165k | 44.9% |
Median sold price and detached homes
Deepcar ranks 67th of 120 for median sold price (£189k) and 13th of 120 for detached homes (39.8%). Across 120 neighbourhoods there is a moderate link between median sold price and detached homes (r = 0.69): the two rise together. Home type drives price: a neighbourhood of detached houses sells for more than one of terraces and flats, whatever else is true of it.
| Neighbourhood | Median sold price | Detached homes |
|---|---|---|
| Stocksbridge | £183k | 21.7% |
| Deepcar | £189k | 39.8% |
| High Green | £203k | 30.4% |
| Burncross | £270k | 24.9% |
| Chapeltown | £217k | 24.1% |
| Grenoside | £288k | 32.3% |
| Ecclesfield | £200k | 21.2% |
| Colley | £208k | 7.9% |
| Shiregreen | £145k | 3.1% |
| Worral | £463k | 54.8% |
| Wharncliffe Side | £260k | 25.8% |
| Oughtibridge | £265k | 29% |
| Middlewood | £208k | 38.7% |
| Foxhill | £169k | 5.7% |
| Parson Cross | £177k | 4.3% |
| Firth Park | £160k | 6.6% |
| Sheffield Lane Top | £165k | 3.9% |
| Birley Carr | £155k | 11.4% |
| Southey | £136k | 4.5% |
| Wadsley Bridge | £171k | 6.8% |
| Longley | £137k | 5.3% |
| Wincobank | £155k | 6% |
| Grimesthorpe | £132k | 7.3% |
| Wadsley | £245k | 12.8% |
| Hillsborough | £220k | 3.8% |
| Owlerton | £150k | 2.2% |
| Tinsley | £84k | 9.2% |
| Darnall | £147k | 7.3% |
| Pitsmoor | £144k | 8.3% |
| Firshill | £90k | 17.3% |
| Shirecliffe | £155k | 6% |
| Osgathorpe | £73k | 7.6% |
| Fir Vale | £111k | 11% |
| Wisewood | £244k | 9.2% |
| Malin Bridge | £213k | 10.2% |
| Page Hall | £79k | 11.3% |
| Wicker | £84k | 0.8% |
| Stannington West | £300k | 40.9% |
| Loxley | £380k | 35.2% |
| Stannington East and Deer Park | £265k | 20.3% |
| Walkley | £240k | 11.6% |
| Crookes | £267k | 4.7% |
| Rivelin | £263k | 14.7% |
| Upperthorpe | £240k | 2.3% |
| Netherthorpe | £108k | 0.9% |
| Crookesmoor | £221k | 7.6% |
| Tapton | £209k | 7.8% |
| Broomhill | £280k | 10.2% |
| Handsworth | £208k | 9.7% |
| Littledale | £148k | 4.3% |
| Crosspool | £370k | 24.1% |
| Sandygate | £373k | 41.5% |
| Endcliffe | £306k | 15.3% |
| Hunters Bar | £335k | 9% |
| Broomhall | £171k | 4.6% |
| Ranmoor | £514k | 16.8% |
| Nether Green | £339k | 17.6% |
| Woodthorpe | £163k | 6.1% |
| Manor | £166k | 4.4% |
| Sharrow | £210k | 3.4% |
| Sharrow Vale | £325k | 6.5% |
| Lodge Moor | £450k | 44.7% |
| Fulwood | £545k | 41.1% |
| Lowfield | £118k | 4.2% |
| Highfield | £170k | 4.2% |
| Nether Edge | £253k | 14.4% |
| Cultural Industries Quarter | £109k | 0.2% |
| Norfolk Park | £222k | 4.7% |
| Arbourthorne | £133k | 4.8% |
| Heeley | £200k | 4% |
| Woodhouse | £190k | 15.4% |
| Richmond | £163k | 3.8% |
| Intake | £175k | 13.4% |
| Carterknowle | £335k | 15.7% |
| Ecclesall | £315k | 35% |
| Greystones | £329k | 6.5% |
| Banner Cross | £296k | 3.7% |
| High Storrs | £423k | 9.2% |
| Hurlfield | £175k | 4.1% |
| Newfield Green | £133k | 3.5% |
| Gleadless Townend | £183k | 12.9% |
| Meersbrook | £250k | 6.7% |
| Gleadless | £150k | 22.8% |
| Parkhead | £610k | 59.4% |
| Millhouses | £385k | 29% |
| Bents Green | £453k | 30.2% |
| Beighton | £195k | 22.6% |
| Hackenthorpe | £190k | 36.1% |
| Woodseats | £228k | 7.6% |
| Herdings | £130k | 3.1% |
| Hemsworth | £136k | 3.7% |
| Owlthorpe | £300k | 52.6% |
| Charnock | £223k | 7.8% |
| Base Green | £186k | 3.7% |
| Sothall | £230k | 61.7% |
| Norton Lees | £258k | 17.8% |
| Meadowhead | £345k | 18.5% |
| Norton | £400k | 36.2% |
| Westfield | £150k | 9.7% |
| Waterthorpe | £168k | 32.2% |
| Halfway | £236k | 39.7% |
| Greenhill | £324k | 23.4% |
| Beauchief | £424k | 30% |
| Dore | £575k | 61.7% |
| Totley | £440k | 27.7% |
| Whirlow | £658k | 63.4% |
| Lowedges | £150k | 1.5% |
| Jordanthorpe | £150k | 3.2% |
| Bradway | £425k | 41.9% |
| Mosborough | £248k | 41.2% |
| Saint Vincent's and Shalesmoor | £90k | 0.3% |
| Neepsend | £164k | 0.9% |
| Cathedral Quarter | £107k | 0.6% |
| City Centre | £130k | 0.2% |
| Devonshire Quarter | £111k | 1.1% |
| Wybourn | £163k | 5.3% |
| Park Hill | £219k | 3.2% |
| Frecheville | £183k | 4.4% |
| Birley | £183k | 5% |
| Birley Spa | £165k | 3.5% |
Aged 65 and over and one-person households
Deepcar ranks 28th of 126 for aged 65 and over (23.5%) and 86th of 126 for one-person households (29.6%). Across 126 neighbourhoods there is a moderate link between aged 65 and over and one-person households (r = -0.52): the two move in opposite directions. Older residents are more likely to live alone, so the two shares tend to rise together; student areas are the usual exception.
| Neighbourhood | Aged 65 and over | One-person households |
|---|---|---|
| Stocksbridge | 24.7% | 30.9% |
| Deepcar | 23.5% | 29.6% |
| High Green | 21.7% | 28.9% |
| Burncross | 32.8% | 26% |
| Chapeltown | 28.3% | 28.1% |
| Grenoside | 30.1% | 28.6% |
| Ecclesfield | 26.2% | 38.1% |
| Colley | 17.1% | 29.7% |
| Shiregreen | 12.8% | 27.5% |
| Worral | 27.2% | 21% |
| Wharncliffe Side | 21.6% | 26.1% |
| Oughtibridge | 18.6% | 28.2% |
| Middlewood | 13.5% | 30.7% |
| Foxhill | 17.2% | 31.6% |
| Parson Cross | 14% | 29.5% |
| Firth Park | 13.9% | 31.8% |
| Sheffield Lane Top | 12.9% | 29.9% |
| Birley Carr | 23.6% | 35.2% |
| Southey | 12.6% | 30.3% |
| Wadsley Bridge | 17.8% | 40% |
| Longley | 17.4% | 35.8% |
| Wincobank | 20.6% | 34.1% |
| Brightside | 10.4% | 32.4% |
| Grimesthorpe | 11.7% | 33.5% |
| Wadsley | 20.4% | 27.8% |
| Hillsborough | 17.5% | 37.6% |
| Winn Gardens | 14.4% | 36.8% |
| Owlerton | 18.7% | 48.7% |
| Tinsley | 11.5% | 24.3% |
| Darnall | 10.9% | 27.9% |
| Pitsmoor | 13.1% | 35.7% |
| Firshill | 13.8% | 45.7% |
| Shirecliffe | 15.2% | 34.8% |
| Osgathorpe | 10.6% | 30.6% |
| Fir Vale | 8.2% | 23.8% |
| Wisewood | 20.9% | 31.2% |
| Malin Bridge | 17.3% | 30.9% |
| Burngreave | 8.9% | 34% |
| Page Hall | 8.1% | 25.5% |
| Wicker | 3% | 50.9% |
| Stannington West | 26.8% | 28.1% |
| Loxley | 28.5% | 26.9% |
| Stannington East and Deer Park | 24.3% | 35% |
| Walkley | 14.4% | 35.6% |
| Crookes | 12.7% | 31.2% |
| Rivelin | 21.2% | 33.5% |
| Upperthorpe | 12.6% | 47.5% |
| Netherthorpe | 2.8% | 53.6% |
| Crookesmoor | 7.8% | 32.6% |
| Tapton | 18.6% | 30.4% |
| Broomhill | 11.7% | 36.5% |
| Handsworth | 20.7% | 29.8% |
| Littledale | 18.3% | 32.7% |
| Crosspool | 21.7% | 21.2% |
| Sandygate | 29.6% | 39.5% |
| Endcliffe | 9.6% | 36.5% |
| Hunters Bar | 8% | 22.4% |
| Broomhall | 6.7% | 40% |
| Ranmoor | 20.7% | 41.6% |
| Nether Green | 19.3% | 30.2% |
| Woodthorpe | 12.3% | 31.4% |
| Manor | 12.5% | 36.9% |
| Sharrow | 5.6% | 45.1% |
| Sharrow Vale | 9.8% | 33.2% |
| Little Sheffield | 4.2% | 48.7% |
| Lodge Moor | 24.7% | 22.1% |
| Fulwood | 28% | 24.3% |
| Lowfield | 5.6% | 31% |
| Highfield | 5% | 35.3% |
| Nether Edge | 14.9% | 35.9% |
| Cultural Industries Quarter | 0.5% | 54.5% |
| Norfolk Park | 11.6% | 33.4% |
| Arbourthorne | 13.8% | 34.6% |
| Heeley | 16.1% | 36.6% |
| Woodhouse | 20.8% | 36.8% |
| Richmond | 17.1% | 32% |
| Intake | 24.8% | 33.8% |
| Carterknowle | 15.7% | 27.3% |
| Ecclesall | 26.2% | 22% |
| Greystones | 15.7% | 24.4% |
| Banner Cross | 7% | 23.7% |
| High Storrs | 21.2% | 20.3% |
| Hurlfield | 19.6% | 29% |
| Newfield Green | 15.9% | 41.1% |
| Gleadless Townend | 28.2% | 33.4% |
| Meersbrook | 12.4% | 32.5% |
| Gleadless | 20.2% | 30.4% |
| Parkhead | 29.7% | 21.9% |
| Millhouses | 23.2% | 25.1% |
| Bents Green | 24.9% | 25.4% |
| Beighton | 17.6% | 28.7% |
| Hackenthorpe | 27.9% | 31.8% |
| Woodseats | 15.6% | 33.3% |
| Herdings | 18.8% | 45.9% |
| Hemsworth | 15.2% | 35.5% |
| Owlthorpe | 18.4% | 26.3% |
| Charnock | 25.1% | 32.1% |
| Base Green | 17.7% | 34.4% |
| Sothall | 18.4% | 22.4% |
| Norton Lees | 23.5% | 28.5% |
| Meadowhead | 29.1% | 28.5% |
| Norton | 30.4% | 35.9% |
| Westfield | 17.2% | 35.2% |
| Waterthorpe | 34.9% | 36.5% |
| Halfway | 21.3% | 30.6% |
| Greenhill | 23.3% | 30.7% |
| Beauchief | 29.8% | 30.7% |
| Dore | 31% | 27.8% |
| Totley | 23% | 33.7% |
| Whirlow | 28.1% | 18.9% |
| Lowedges | 12% | 39.7% |
| Jordanthorpe | 17.7% | 45.8% |
| Batemoor | 11.9% | 40.6% |
| Bradway | 28.1% | 27.6% |
| Mosborough | 19.5% | 25.2% |
| Saint Vincent's and Shalesmoor | 1.2% | 52.7% |
| Neepsend | 2.3% | 50.1% |
| Cathedral Quarter | 1.3% | 53.1% |
| City Centre | 2.2% | 58.7% |
| Devonshire Quarter | 1.9% | 51.5% |
| Wybourn | 13.4% | 28.1% |
| Park Hill | 11.9% | 45.5% |
| Hyde Park | 6.4% | 33.6% |
| Frecheville | 18.9% | 24.8% |
| Birley | 19% | 29.8% |
| Birley Spa | 17.9% | 34.4% |
Source: Office for National Statistics licensed under the Open Government Licence v.3.0. Census 2021 tables via Nomis; population-weighted centroids from ONS Open Geography, contains OS data © Crown copyright and database right 2026. Contains HM Land Registry data © Crown copyright and database right 2026. This data is licensed under the Open Government Licence v3.0. All data sources
More 2 cards
Problems people reported here
12 problems reported to the council through FixMyStreet in the last 60 days. Each one is somebody's report, not a verified fact.
- Pavements/footpaths still open on FixMyStreet · reported 2 days ago
- Trees still open on FixMyStreet · reported 4 days ago
- Roads/highways still open on FixMyStreet · reported 4 days ago
- Trees still open on FixMyStreet · reported 4 days ago
- Flytipping still open on FixMyStreet · reported 3 weeks ago
- Flytipping still open on FixMyStreet · reported 3 weeks ago
- Flytipping still open on FixMyStreet · reported 3 weeks ago
- Flytipping still open on FixMyStreet · reported 3 weeks ago
- Dog fouling still open on FixMyStreet · reported 4 weeks ago
- Parks/landscapes still open on FixMyStreet · reported 4 weeks ago
- Rubbish (refuse and recycling) still open on FixMyStreet · reported 1 month ago
- Rubbish (refuse and recycling) still open on FixMyStreet · reported 1 month ago
Alerts
Follow Deepcar and hear what happens here: new events and places listed, planning applications, roadworks, storm overflows, floods and poor air. Floods and overflows arrive straight away; the rest come as one round-up at 8am, grouped by area.
Yorkshire Water (CC BY 4.0), Environment Agency (OGL v3), UK PlanIt and TomTom via the live map.
Deepcar: your questions answered
Which areas are next to Deepcar?
The areas nearest to Deepcar are Wharncliffe Side, Ewden and Bolsterstone, Stocksbridge. Each has its own page with the events and places inside it.
How is the Deepcar boundary defined?
The boundary is the Deepcar polygon from the Sheffield neighbourhoods dataset published by Data for Action, one of 147 across the city. Events, businesses, places and charities are placed inside it by their coordinates, so a venue just over the line appears on the neighbouring page instead.
Neighbouring areas
Neighbourhood boundaries by Data for Action, licensed CC BY 4.0 and used with credit. Snapshot 946d748, published 16 Dec 2025, last checked 13 Oct 2026. Records are placed by their stored coordinates; a point on a shared boundary belongs to the first neighbourhood in the source file. All data sources