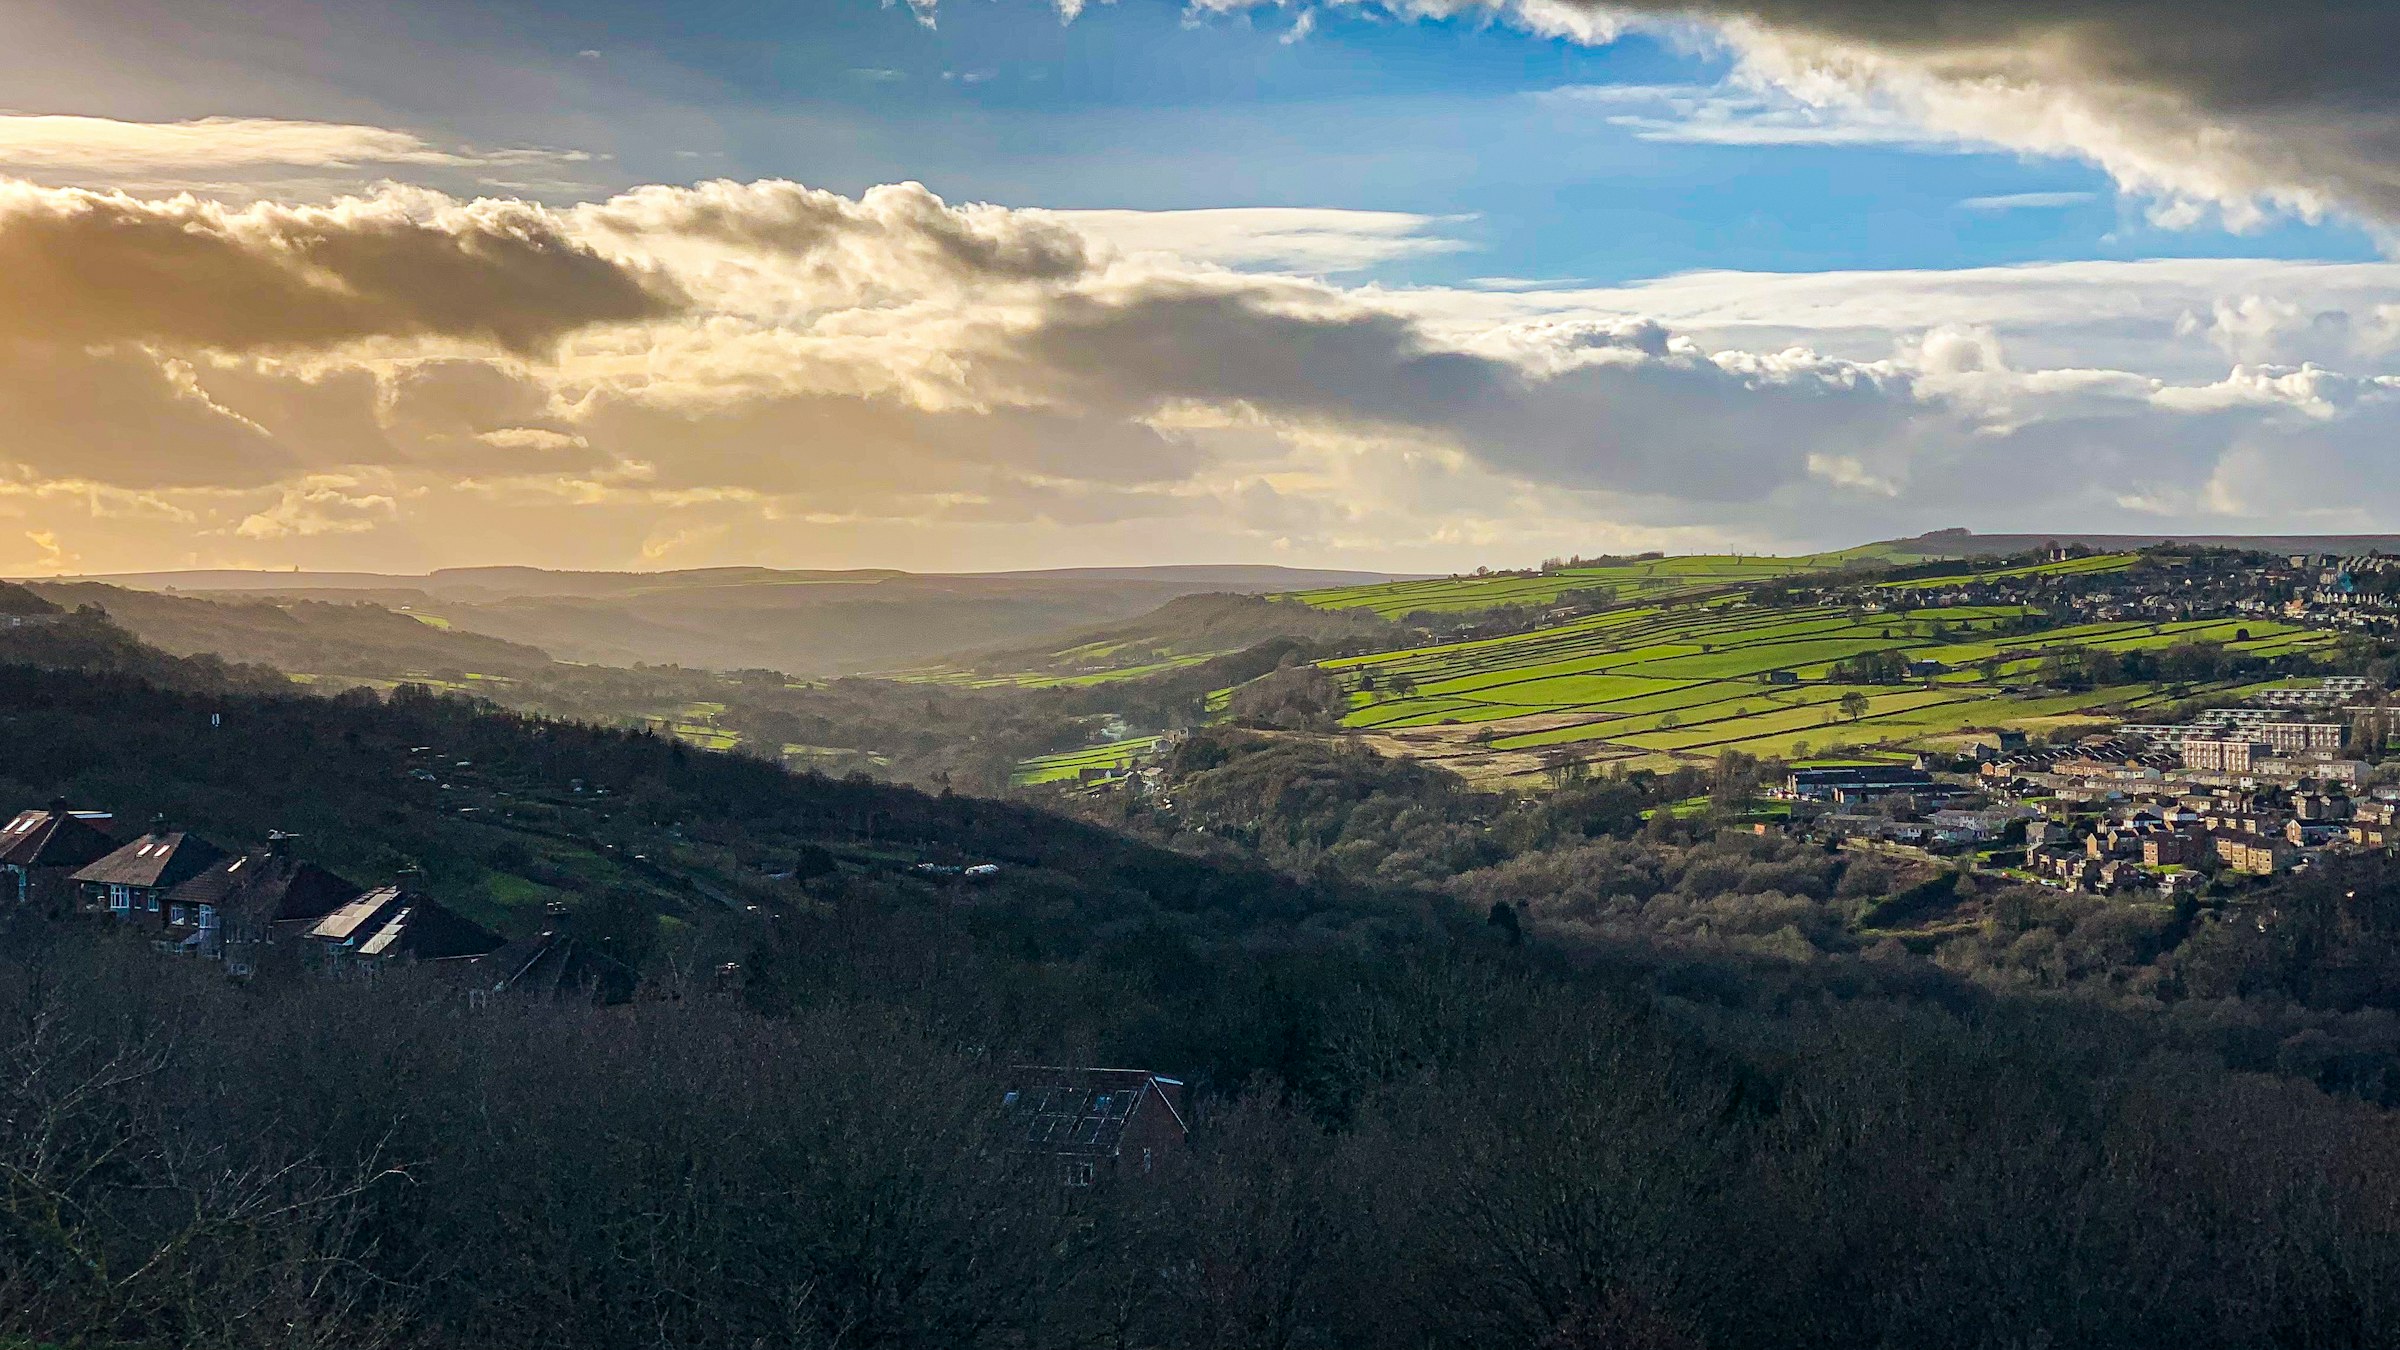
Photograph: Shane Rounce on Unsplash
Sheffield, shared
Explore Sheffield by area
Sheffield’s 147 neighbourhoods as mapped by Data for Action, each with the events, businesses, places and charities located inside its boundary, plus the area tags used on published listings.
Check one postcode instead: cost, noise, tenure, crime, schools and flooding for that exact spot
Sheffield’s 147 neighbourhoods
Community-drawn boundaries from Data for Action. Counts are the published events, classes, businesses, places and charities whose stored location falls inside each boundary.
The bell beside an area follows it: new events and places listed there, planning, roadworks, overflows and floods, as one round-up each morning grouped by area.
- City Centre 1,274
- Owlerton 671
- Cultural Industries Quarter 265
- Jordanthorpe 240
- High Green 182
- Carbrook 132
- Attercliffe 117
- Neepsend 106
- The Moor 99
- Castlegate 81
- St. George's 76
- Shiregreen 63
- Highfield 62
- Devonshire Quarter 58
- Heeley 58
- Cathedral Quarter 53
- Colley 51
- Carterknowle 49
- Handsworth 49
- Broomhill 46
- Hillsborough 41
- Nether Edge 40
- Broomhall 39
- Chapeltown 32
- Hurlfield 31
- Wadsley 27
- Norfolk Park 26
- Sharrow Vale 26
- Crookes 25
- Wicker 25
- Kelham 23
- Bradfield 21
- Totley 21
- Sharrow 20
- Bents Green 19
- Stocksbridge 19
- Wisewood 19
- Greystones 18
- Hunters Bar 18
- Lowfield 18
- Manor 18
- Dore 17
- Grenoside 17
- Stannington West 17
- High Storrs 16
- Lodge Moor 16
- Norton 16
- Saint Vincent's and Shalesmoor 16
- Tinsley 16
- Wybourn 16
- Burngreave 15
- Darnall 15
- Ecclesfield 15
- Beauchief 14
- Fulwood 14
- Whirlow 14
- Millhouses 13
- Arbourthorne 12
- Beighton 12
- Crosspool 12
- Endcliffe 12
- Norton Lees 12
- Grimesthorpe 11
- Mosborough 11
- Nether Green 11
- Woodthorpe 11
- Bradway 10
- Ecclesall 10
- Meersbrook 10
- Park Hill 10
- Wadsley Bridge 10
- Woodhouse 10
- Woodseats 10
- Firth Park 9
- Intake 9
- Netherthorpe 9
- Oughtibridge 9
- Stannington East and Deer Park 9
- Waterthorpe 9
- Banner Cross 8
- Parkwood Springs 8
- Sandygate 8
- Tapton 8
- Deepcar 7
- Frecheville 7
- Hackenthorpe 7
- Charnock 6
- Gleadless 6
- Greenhill 6
- Little Sheffield 6
- Parson Cross 6
- Shirecliffe 6
- Hemsworth 5
- Pitsmoor 5
- Richmond 5
- Upperthorpe 5
- Walkley 5
- Batemoor 4
- Birley Spa 4
- Ellesmere 4
- Fir Vale 4
- Hyde Park 4
- Norton Hammer 4
- Rivelin 4
- Westfield 4
- Brincliffe 3
- Foxhill 3
- Halfway 3
- Littledale 3
- Longley 3
- Loxley 3
- Middlewood 3
- Philadelphia 3
- Sheffield Lane Top 3
- Wharncliffe Side 3
- Wincobank 3
- Brightside 2
- Crookesmoor 2
- Hollinsend 2
- Lowedges 2
- Malin Bridge 2
- Meadowhead 2
- Newfield Green 2
- Page Hall 2
- Ranmoor 2
- Ringinglow 2
- Southey 2
- Worral 2
- Burncross 1
- Dungworth 1
- Ewden and Bolsterstone 1
- Firshill 1
- Gleadless Townend 1
- Herdings 1
- Hill Top 1
- Holbrook 1
- Midhopestones 1
- Owlthorpe 1
- Parkhead 1
- Sothall 1
- Winn Gardens 1
- Base Green
- Birley
- Birley Carr
- Normanton Spring
- Norwood
- Osgathorpe
Neighbourhood boundaries by Data for Action, licensed CC BY 4.0 and used with credit. Snapshot 946d748, published 16 Dec 2025, last checked 13 Oct 2026. Records are placed by their stored coordinates; a point on a shared boundary belongs to the first neighbourhood in the source file. All data sources
Area pages with local listings
Counts describe published Sheffield Events records. An area is omitted until at least one record is attached to it.
Open the Sheffield neighbourhood map
Sheffield
What's on in Sheffield – discover events, gigs, markets and things to do in Sheffield, Sheffield. Browse by date on a live map, find…
City Centre
What's on in City Centre – discover events, gigs, markets and things to do in City Centre, Sheffield. Browse by date on a live…
Rotherham
What's on in Rotherham – discover events, gigs, markets and things to do in Rotherham, Sheffield. Browse by date on a live map, find…
Barnsley
What's on in Barnsley – discover events, gigs, markets and things to do in Barnsley, Sheffield. Browse by date on a live map, find…
Attercliffe
What's on in Attercliffe – discover events, gigs, markets and things to do in Attercliffe, Sheffield. Browse by date on a live map, find…
Owlerton
Shiregreen
What's on in Shiregreen – discover events, gigs, markets and things to do in Shiregreen, Sheffield. Browse by date on a live map, find…
High Green
Heeley
What's on in Heeley – discover events, gigs, markets and things to do in Heeley, Sheffield. Browse by date on a live map, find…
Wisewood
Neepsend
What's on in Neepsend – discover events, gigs, markets and things to do in Neepsend, Sheffield. Browse by date on a live map, find…
Hillsborough
What's on in Hillsborough – discover events, gigs, markets and things to do in Hillsborough, Sheffield. Browse by date on a live map, find…
Ecclesall
What's on in Ecclesall – discover events, gigs, markets and things to do in Ecclesall, Sheffield. Browse by date on a live map, find…
Castlegate
Darnall
What's on in Darnall – discover events, gigs, markets and things to do in Darnall, Sheffield. Browse by date on a live map, find…
Broomhill
What's on in Broomhill – discover events, gigs, markets and things to do in Broomhill, Sheffield. Browse by date on a live map, find…
Kelham Island
What's on in Kelham Island – discover events, gigs, markets and things to do in Kelham Island, Sheffield. Browse by date on a live…
Highfield
Devonshire Quarter
Fulwood
What's on in Fulwood – discover events, gigs, markets and things to do in Fulwood, Sheffield. Browse by date on a live map, find…
Greystones
Nether Edge
What's on in Nether Edge – discover events, gigs, markets and things to do in Nether Edge, Sheffield. Browse by date on a live…
Crookes
What's on in Crookes – discover events, gigs, markets and things to do in Crookes, Sheffield. Browse by date on a live map, find…
Chesterfield
What's on in Chesterfield – discover events, gigs, markets and things to do in Chesterfield, Sheffield. Browse by date on a live map, find…
Stannington
What's on in Stannington – discover events, gigs, markets and things to do in Stannington, Sheffield. Browse by date on a live map, find…
Broomhall
Lowfield
Burngreave
What's on in Burngreave – discover events, gigs, markets and things to do in Burngreave, Sheffield. Browse by date on a live map, find…
Sharrow Vale
University
Chapeltown
What's on in Chapeltown – discover events, gigs, markets and things to do in Chapeltown, Sheffield. Browse by date on a live map, find…
Sharrow
What's on in Sharrow – discover events, gigs, markets and things to do in Sharrow, Sheffield. Browse by date on a live map, find…
Dinnington
Walkley
What's on in Walkley – discover events, gigs, markets and things to do in Walkley, Sheffield. Browse by date on a live map, find…
Beighton
Gleadless Valley
Doncaster
What's on in Doncaster – discover events, gigs, markets and things to do in Doncaster, Sheffield. Browse by date on a live map, find…
Dronfield
Mosborough
What's on in Mosborough – discover events, gigs, markets and things to do in Mosborough, Sheffield. Browse by date on a live map, find…
Meersbrook
What's on in Meersbrook – discover events, gigs, markets and things to do in Meersbrook, Sheffield. Browse by date on a live map, find…
Firth Park
What's on in Firth Park – discover events, gigs, markets and things to do in Firth Park, Sheffield. Browse by date on a live…
Southey
What's on in Southey – discover events, gigs, markets and things to do in Southey, Sheffield. Browse by date on a live map, find…
Norton Lees
Oughtibridge
What's on in Oughtibridge – discover events, gigs, markets and things to do in Oughtibridge, Sheffield. Browse by date on a live map, find…
Woodhouse
What's on in Woodhouse – discover events, gigs, markets and things to do in Woodhouse, Sheffield. Browse by date on a live map, find…
Wybourn
What's on in Wybourn – discover events, gigs, markets and things to do in Wybourn, Sheffield. Browse by date on a live map, find…
City Centre, Sheffield
Elsecar
Wicker
Castleton
Endcliffe
Penistone
Wentworth
Bakewell
Eckington
Hunters Bar
Matlock
North Anston
Cawthorne
Norton
What's on in Norton – discover events, gigs, markets and things to do in Norton, Sheffield. Browse by date on a live map, find…
Palterton
Parson Cross
What's on in Parson Cross – discover events, gigs, markets and things to do in Parson Cross, Sheffield. Browse by date on a live…
Peak District
Woodseats
What's on in Woodseats – discover events, gigs, markets and things to do in Woodseats, Sheffield. Browse by date on a live map, find…
Worksop
Grenoside
Handsworth
What's on in Handsworth – discover events, gigs, markets and things to do in Handsworth, Sheffield. Browse by date on a live map, find…
Shalesmoor
Woodsetts
Bamford
Buxton
Crich
Manor
What's on in Manor – discover events, gigs, markets and things to do in Manor, Sheffield. Browse by date on a live map, find…
Manvers
Meadowhall
Oldcotes
Wath upon Dearne
Abbeydale
Clay Cross
Great Longstone, Derbyshire
Palterton (near Bolsover)
Parkwood Springs
Rother Valley, Rotherham
Templeborough
Thorpe Hesley
Victoria Quays
Ashover
Bakewell, Derbyshire
Barlow, Derbyshire
Bradfield
Brecks
Broomhall, Sheffield
Castleton, Hope Valley
Catcliffe, Rotherham
Cawthorne, Barnsley
Chatsworth
Chatsworth, Derbyshire
Coal Aston
Crookes, Sheffield
Crosspool
What's on in Crosspool – discover events, gigs, markets and things to do in Crosspool, Sheffield. Browse by date on a live map, find…
Derbyshire
What's on in Derbyshire – discover events, gigs, markets and things to do in Derbyshire, Sheffield. Browse by date on a live map, find…
Dore
What's on in Dore – discover events, gigs, markets and things to do in Dore, Sheffield. Browse by date on a live map, find…
Ecclesfield
What's on in Ecclesfield – discover events, gigs, markets and things to do in Ecclesfield, Sheffield. Browse by date on a live map, find…
Edale
Edale, Hope Valley
Elsecar, Barnsley
Eyam, Derbyshire
Gleadless
What's on in Gleadless – discover events, gigs, markets and things to do in Gleadless, Sheffield. Browse by date on a live map, find…
Hardstoft
Harthill
Hassop, Derbyshire
Hathersage
Hollingwood
Kelham Island / Neepsend
Lodge Moor
Loxley
Malin Bridge
Manor, Sheffield
Matlock Bath
Matlock, Derbyshire
Mexborough
Millhouses
North Anston, Rotherham
Norton, Sheffield
Penistone, Barnsley
Rawmarsh
Rotherhan
Sharrow Vale, Sheffield
Shireoaks
Stannington, Sheffield
Stoney Middleton
Thorpe Hesley, Rotherham
Upperthorpe
Wakefield
Waterthorpe
Wentworth, Rotherham
Weston Park
Whirlow, Sheffield
Wortley
Arbourthorne
What's on in Arbourthorne – discover events, gigs, markets and things to do in Arbourthorne, Sheffield. Browse by date on a live map, find…
Bramall Lane
Castlegate and Victoria Quays
Chapeltown, Sheffield
What's on in Chapeltown, Sheffield – discover events, gigs, markets and things to do in Chapeltown, Sheffield, Sheffield. Browse by date on a live…
Crosspool, Sheffield
What's on in Crosspool, Sheffield – discover events, gigs, markets and things to do in Crosspool, Sheffield, Sheffield. Browse by date on a live…
Ecclesall Road
Fir Vale
Gleadless Townend
Goldthorpe
High Peak
Highfield / Little Sheffield
Highfield, Sheffield
Hillsborough, Sheffield
What's on in Hillsborough, Sheffield – discover events, gigs, markets and things to do in Hillsborough, Sheffield, Sheffield. Browse by date on a live…
Kelham Island / Neepsend, Sheffield
What's on in Kelham Island / Neepsend, Sheffield – discover events, gigs, markets and things to do in Kelham Island / Neepsend, Sheffield, Sheffield.…
Longley
Manvers / Wath upon Dearne
Meadowhead
Middlewood
New Mills
Oldcotes (Worksop)
Park Hill
Parkwood
Shirecliffe
Stocksbridge
What's on in Stocksbridge – discover events, gigs, markets and things to do in Stocksbridge, Sheffield. Browse by date on a live map, find…
Tansley
The Wicker
Tinsley
Totley
What's on in Totley – discover events, gigs, markets and things to do in Totley, Sheffield. Browse by date on a live map, find…
University / Broomhall
West Street
Westfield
Coming up around Sheffield
The next events that have been filed against a Sheffield area.
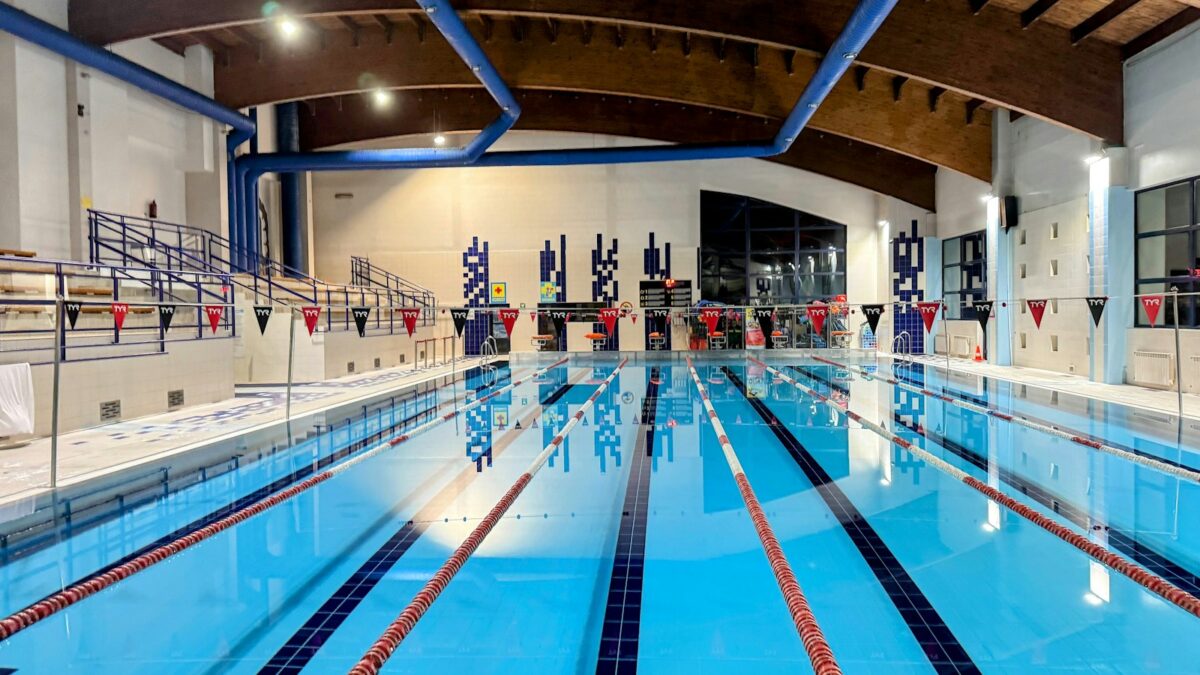 Illustrative activity photo: Mariusz Smenzyk on Unsplash
Event
Fam Waterslides
This session is in the Leisure Pool.Sessions for everyone, floats and fun toys may be available or bring along your own and our amazing water slide(s)…
Event
Public Swimming
This session is in the Main Pool.For everyone to experience the fun, relaxing and invigorating activity that swimming is. Dip your toe in, the water's lovely!All…
Event
Fam Waterslides
This session is in the Leisure Pool.Sessions for everyone, floats and fun toys may be available or bring along your own and our amazing water slide(s)…
Event
Fam Waterslides
This session is in the Leisure Pool.Sessions for everyone, floats and fun toys may be available or bring along your own and our amazing water slide(s)…
Event
Fam Waterslides
This session is in the Leisure Pool.Sessions for everyone, floats and fun toys may be available or bring along your own and our amazing water slide(s)…
Worth a look 1 card
- Wettest gauge this week59.5 mmat Redmires in the last 7 daysupdated 2 days ago
- Busiest neighbourhood per headCity Centre52 events this week, 35.4 per 1,000 residentslive from the listings
- Most planning applicationsBroomhill And Sharrow Vale29 lodged this month in the wardlast 30 days
- Busiest counted roadM1 34 to 34138,072 motor vehicles a day2025 counts
- Quietest area with a tram stopCathedral Quarterquiet score 100 of 100updated 17 h ago
- Moving right now462462 busesupdated just now
Scorecard 4 cards
Neighbourhood scorecards
Every one of the 147 neighbourhoods scored 0 to 100 on seven things people ask about, each a rank against the others built from open data. Tick what matters to you and the table re-ranks; hover a score for the figures behind it.
All 147 neighbourhoods, best match first.
Area finder: rank Sheffield by what matters to you
Give each thing a weight out of 5, tick anything you will not live without, and all 147 neighbourhoods re-rank. Every result shows what put it there, so you can argue with it. The address bar carries your weighting, so the link you copy is your ranking, not ours.
1 St. George's 83
Overall 83 of 100, the mean of the 4 dimensions that could be scored. Weight what matters to you above and this line changes.
2 Waterthorpe 81
Overall 81 of 100, the mean of the 6 dimensions that could be scored. Weight what matters to you above and this line changes.
3 Firth Park 77
Overall 77 of 100, the mean of the 6 dimensions that could be scored. Weight what matters to you above and this line changes.
4 Parkwood Springs 75
Overall 75 of 100, the mean of the 5 dimensions that could be scored. Weight what matters to you above and this line changes.
5 Cathedral Quarter 75
Overall 75 of 100, the mean of the 6 dimensions that could be scored. Weight what matters to you above and this line changes.
All 147 neighbourhoods, best match first.
Living here 5 cards
Census 2021
How Sheffield lives
Headline figures for the 556,594 people counted in Sheffield at the 2021 census. Every neighbourhood page compares its own figures with these.
- Most common way to work
- Driving 45.2%
- Owner-occupied homes
- 58.6%
- Households without a car
- 29.2%
- Born outside the UK
- 14.9%
- Most common answer on religion
- No religion 43.4%
- Degree-level qualified, 16 and over
- 33.4%
- In very good health
- 46.7%
- Disabled under the Equality Act
- 19.7%
- Households deprived in at least one dimension
- 54.6%
Where people walk or cycle to work
Share of workers who walked or cycled. Across Sheffield it was 10%.
- Broomhall 26.5% 1,783 workers aged 16 and over
- Crookesmoor 24.2% 2,278 workers aged 16 and over
- Cultural Industries Quarter 23.9% 867 workers aged 16 and over
- Netherthorpe 23.8% 1,065 workers aged 16 and over
- Sharrow Vale 23.6% 1,480 workers aged 16 and over
- Highfield 23.6% 1,737 workers aged 16 and over
Where most residents were born outside the UK
Across Sheffield it was 14.9%.
- Netherthorpe 57.3% 4,126 residents
- Page Hall 52.7% 5,173 residents
- Saint Vincent's and Shalesmoor 52.2% 4,665 residents
- City Centre 51% 1,468 residents
- Cathedral Quarter 50.5% 1,988 residents
- Burngreave 47.7% 5,559 residents
Source: Office for National Statistics, Census 2021, via Nomis, Open Government Licence v3.0. Neighbourhood figures sum the census areas whose population-weighted centres (ONS Open Geography, contains OS data © Crown copyright and database right 2026) fall inside each boundary. Census 2021 on Nomis · All data sources
Deprivation
How deprivation is spread across Sheffield
Sheffield has 345 small areas (LSOAs). The 2019 Index of Multiple Deprivation ranks every LSOA in England; 82 of Sheffield's sit in the most deprived tenth nationally and 34 in the least deprived tenth, one of the widest spreads of any English city.
Every small area on the Sheffield map, coloured by decile
Deprivation: English Indices of Deprivation 2019 by LSOA (MHCLG) with ONS population-weighted centroids, Open Government Licence v3.0. Decile 1 is the most deprived tenth of England. Indices of Deprivation 2019 · ONS Open Geography Portal · All data sources
| Point | Sheffield LSOAs |
|---|---|
| 1 (most deprived) | 82 |
| 2 | 36 |
| 3 | 26 |
| 4 | 22 |
| 5 | 31 |
| 6 | 31 |
| 7 | 26 |
| 8 | 27 |
| 9 | 30 |
| 10 (least deprived) | 34 |
People and health 1 card
627,369 people were registered with the 73 GP practices in the Sheffield area of NHS South Yorkshire in October 2026. List sizes count registrations, not residents: students, people who have moved and anyone registered elsewhere make the figure differ from the population.
- Registered patients
- 627,369October 2026
- Change on the month
- +2,686since September 2026
- Change on the year
- -2.0%-12,838 since October 2025
- Practices
- 73average list 8,594
Largest lists
- University Health Service Health Centre34,220 patients · +4,513 on the month · -7.5% on the year
- Porter Brook Medical Centre26,564 patients · +851 on the month · -1.7% on the year
- Meadowgreen Health Centre18,739 patients · -71 on the month · -1.3% on the year
- Walkley House & Stannington M.c15,520 patients · -78 on the month · -3.2% on the year
- Clover Group Practice15,063 patients · -182 on the month · -5.8% on the year
Smallest lists
- The Medical Centre Dr Okorie1,124 patients · +2 on the month · -2.8% on the year
- Veritas Health Centre1,286 patients · -40 on the month · -11.0% on the year
- Barnsley Road Surgery2,193 patients · -22 on the month · -8.1% on the year
- Harold Street Medical Centre2,214 patients · -73 on the month · -14.4% on the year
- Selborne Road Medical Centre2,303 patients · -27 on the month · -4.6% on the year
Each practice's list size and its change on the month and the year are on its neighbourhood page. 5 months of totals are held for the chart.
Contains information from NHS England, licenced under the current version of the Open Government Licence (Open Government Licence). Checked 26 Oct 2026. Patients registered at a GP practice · All data sources
Getting around 6 cards
Getting about
The reason most people stay in is not knowing whether they can get home. These work it out from the timetables, prices and maps this site already stores, and say plainly what they cannot answer.
What is on within a walk
Only what you can genuinely reach on foot or by one bus.
Quiet route and quiet times
The calmer way between two points, and the hours the roads are emptiest.
Cheapest fuel on my route
The cheapest forecourt on the way, not the cheapest in the city.
Traffic on Sheffield's roads
- M1 southbound between J31 and J32: 68,997 vehicles on Mon 29 Jun · average 65 mph · 27.7% large vehicles
- M1 34 to 34: 138,072 motor vehicles a day (2025) · estimated
- M1 34 to 35: 136,926 motor vehicles a day (2025) · counted
- M1 35 to LA boundary: 127,194 motor vehicles a day (2025) · counted
Department for Transport STATS19
Road collisions in Sheffield, 2021 to 2025
South Yorkshire Police recorded 3,953 road collisions in Sheffield in which someone was hurt, 2021 to 2025: 53 of them fatal and 1,212 serious. 988 pedestrians and 607 cyclists were among the 5,019 people hurt. Collisions with no injury are not recorded in STATS19, and fatal collisions are counted here but never shown as a point.
- Collisions
- 3,953
- Fatal
- 53
- Serious
- 1,212
- Slight
- 2,688
- People hurt
- 5,019
- Pedestrians hurt
- 988
- Cyclists hurt
- 607
Year by year
- 2021: 12 fatal, 202 serious, 549 slight958 hurt (pedestrians 168, cyclists 114)
- 2022: 8 fatal, 266 serious, 492 slight979 hurt (pedestrians 196, cyclists 118)
- 2023: 14 fatal, 252 serious, 554 slight1,063 hurt (pedestrians 209, cyclists 108)
- 2024: 11 fatal, 223 serious, 532 slight964 hurt (pedestrians 180, cyclists 123)
- 2025: 8 fatal, 269 serious, 561 slight1,055 hurt (pedestrians 235, cyclists 144)
Neighbourhoods with the most fatal and serious collisions
- City Centre / Town Centre / Heart of the City29 fatal or serious of 66 collisions; 40 pedestrians and 6 cyclists hurt
- Manor / Manor Lodge / Manor Top26 fatal or serious of 64 collisions; 14 pedestrians and 3 cyclists hurt
- Tinsley22 fatal or serious of 90 collisions; 8 pedestrians and 6 cyclists hurt
- Handsworth22 fatal or serious of 61 collisions; 23 pedestrians and 1 cyclists hurt
- Darnall21 fatal or serious of 86 collisions; 21 pedestrians and 9 cyclists hurt
- Attercliffe21 fatal or serious of 75 collisions; 5 pedestrians and 8 cyclists hurt
- Shiregreen20 fatal or serious of 70 collisions; 10 pedestrians and 5 cyclists hurt
- Firth Park19 fatal or serious of 61 collisions; 18 pedestrians and 1 cyclists hurt
Serious and slight collisions on the Local Map
Road collision data from the Department for Transport (STATS19 road safety open data), Open Government Licence v3.0 Open Government Licence v3.0. Checked 12 Oct 2026. Road safety open data · All data sources
Office of Rail and Road
Sheffield by rail, April 2024 to March 2025
Sheffield station saw an estimated 10.3 million entries and exits from April 2024 to March 2025, ranked 49 of 2,586 stations in Great Britain. Its busiest connection was Manchester Piccadilly, with 898,646 journeys. These are estimates built from ticket sales, not counts at the gates: a return trip from a station counts there as one entry and one exit, and journeys on South Yorkshire's local tickets are added from local data.
- Entries and exits
- 10,315,220
- Rank in Great Britain
- 49
- Interchanges
- 937,768
- On season tickets
- 6%
- On the year before
- +9%
Sheffield's stations
- Sheffield: 10,315,220 entries and exits, ranked 49 of 2,586 stations in Great BritainBusiest connection Manchester Piccadilly (898,646 journeys); 937,768 interchanges; run by East Midlands Railway; +9% on the year beforeCity Centre / Town Centre / Heart of the City
- Meadowhall: 1,910,838 entries and exits, ranked 297 of 2,586 stations in Great BritainBusiest connection Sheffield (435,736 journeys); 48,761 interchanges; run by Northern Trains; +14% on the year beforeBrightside
- Chapeltown: 382,952 entries and exits, ranked 1,008 of 2,586 stations in Great BritainBusiest connection Sheffield (122,154 journeys); run by Northern Trains; +16% on the year beforeChapeltown
- Dore and Totley: 240,254 entries and exits, ranked 1,274 of 2,586 stations in Great BritainBusiest connection Manchester Piccadilly (80,898 journeys); run by Northern Trains; +20% on the year beforeDore
- Woodhouse: 40,388 entries and exits, ranked 2,121 of 2,586 stations in Great BritainBusiest connection Sheffield (12,946 journeys); run by Northern Trains; +21% on the year beforeWoodhouse
- Darnall: 22,132 entries and exits, ranked 2,261 of 2,586 stations in Great BritainBusiest connection Sheffield (5,750 journeys); run by Northern Trains; +11% on the year beforeLittledale
Busiest stations in South Yorkshire
- Sheffield: 10,315,220Rank 49 in Great Britain; busiest connection Manchester Piccadilly
- Doncaster: 4,533,514Rank 121 in Great Britain; busiest connection London Kings Cross
- Meadowhall: 1,910,838Rank 297 in Great Britain; busiest connection Sheffield
- Barnsley: 1,519,762Rank 366 in Great Britain; busiest connection Sheffield
- Rotherham Central: 463,418Rank 904 in Great Britain; busiest connection Sheffield
- Chapeltown (South Yorkshire): 382,952Rank 1,008 in Great Britain; busiest connection Sheffield
- Swinton (South Yorks): 346,188Rank 1,082 in Great Britain; busiest connection Sheffield
- Dore and Totley: 240,254Rank 1,274 in Great Britain; busiest connection Manchester Piccadilly
- Wombwell: 223,542Rank 1,326 in Great Britain; busiest connection Sheffield
- Elsecar: 196,124Rank 1,406 in Great Britain; busiest connection Sheffield
- Thorne North: 178,734Rank 1,459 in Great Britain; busiest connection Doncaster
- Adwick: 175,978Rank 1,467 in Great Britain; busiest connection Doncaster
Of the 30 stations where ORR adds South Yorkshire's local ticketing data.
Estimates of station usage from the Office of Rail and Road, Open Government Licence v3.0. Station points from DfT NaPTAN. Checked 12 Oct 2026. Estimates of station usage · All data sources
National Cycle Network
Signed cycle routes through Sheffield
4 numbered National Cycle Network routes run through Sheffield, 120.9 km of signed route of which 65% is traffic-free and 26% is lit. The Walk Wheel Cycle Trust, which used to be Sustrans, maps every segment with its surface and lighting and flags closures.
- Numbered routes
- 4
- Km in Sheffield
- 120.9
- Traffic-free
- 65%
- Closed now
- 3
Route by route
- 130 segments Route 6751.9 km in Sheffield · 66% traffic-free · 29% lit · mostly asphalt, firm unsealed, loose unsealed
- 120 segments Route 641.3 km in Sheffield · 46% traffic-free · 27% lit · mostly asphalt, firm unsealed, block paving · 3 segments closed (0.6 km)
- 37 segments Route 62723.0 km in Sheffield · 90% traffic-free · 21% lit · mostly firm unsealed, asphalt, block paving
- 6 segments Trans Pennine Trail (Route 62)2.5 km in Sheffield · 92% traffic-free · 9% lit · mostly asphalt, paving slabs
- 8 segments Unnumbered links2.2 km in Sheffield · 100% traffic-free · 13% lit · mostly asphalt, firm unsealed, other
Closures the trust has recorded
- Temporary Closure Route 6traffic-free · bare earth · unlit · 0.1 km · temporary closure · near Attercliffe
- Temporary Closure Route 6traffic-free · asphalt · unlit · 0.4 km · temporary closure · near Attercliffe
- Temporary Closure Route 6traffic-free · asphalt · partly lit · 0.1 km · temporary closure · near Attercliffe
The council's own signed cycle routes and the Trans Pennine Trail's local spurs are on the parks map; this layer is the national network as the trust records it. Council cycle routes
National Cycle Network data from the Walk Wheel Cycle Trust (formerly Sustrans) under the Open Government Licence v3.0. Contains Ordnance Survey data © Crown copyright and database rights 2018. Open Government Licence v3.0. Checked 26 Oct 2026. The dataset on ArcGIS · All data sources
Environment and sky 19 cards
Rain and river levels
46.4 mm of rain on average across 12 Sheffield gauges in the last 7 days. Wettest Redmires (59.5 mm), driest Wombwell (25.0 mm). Wettest day at Redmires: Saturday 24 Oct, 28.8 mm.
- River Don at Sheffield Lady's Bridge 0.48 m, steady (week 0.40 to 0.83 m)
- River Sheaf at Highfield 0.25 m, falling (week 0.17 to 0.60 m)
- Porter Brook at Sheffield Station 0.09 m, steady (week 0.07 to 0.27 m)
- River Loxley at Malinbridge 0.25 m, steady (week 0.19 to 0.40 m)
- River Rivelin at Sheffield Hollins Bridge 0.32 cubic metres a second daily mean, rising
Storm overflows right now
No overflow is discharging now; 79 have discharged in the last 48 hours. 461 monitors on the Don, Sheaf, Porter, Rivelin, Loxley, Rother and their brooks; 12 offline.
- 🟠 Discharged in the last 48 hours Porter Brook Discharged in the last 48 hours · last discharge ended 27 Oct 05:12
- 🟠 Discharged in the last 48 hours Porter Brook Discharged in the last 48 hours · last discharge ended 27 Oct 04:47
- 🟠 Discharged in the last 48 hours Porter Brook Discharged in the last 48 hours · last discharge ended 27 Oct 04:46
- 🟠 Discharged in the last 48 hours River Don Discharged in the last 48 hours · last discharge ended 27 Oct 04:46
- 🟠 Discharged in the last 48 hours Meers Brook (Culverted) Discharged in the last 48 hours · last discharge ended 26 Oct 12:33
- 🟠 Discharged in the last 48 hours River Sheaf Discharged in the last 48 hours · last discharge ended 27 Oct 04:51
- 🟠 Discharged in the last 48 hours Trib Of Meers Brook Discharged in the last 48 hours · last discharge ended 26 Oct 12:46
- 🟠 Discharged in the last 48 hours River Loxley Discharged in the last 48 hours · last discharge ended 27 Oct 04:46
- 🟠 Discharged in the last 48 hours Culverted Trib Of Bagley Dike Discharged in the last 48 hours · last discharge ended 27 Oct 04:46
- 🟠 Discharged in the last 48 hours Kirkbridge Dike (Culverted) Discharged in the last 48 hours · last discharge ended 27 Oct 05:01
All overflows on the map · checked 28 Oct 07:56
Citizen air sensors
26 low-cost particulate sensors report from around Sheffield; 26 have read in the last three hours. Median PM2.5 2.0 and PM10 9.5 µg/m³ (WHO 24-hour guidelines: 15 and 45).
- ● 26 within who guideline
Recorded flood outlines
Where Sheffield has flooded before
The Environment Agency has mapped 114 flood footprints inside Sheffield, from 29 named events between 1947 and 2023. Each outline records where water reached once; it is history, not a forecast, and floods that nobody surveyed are not here.
- Outlines
- 114
- Named events
- 29
- Earliest
- 1947
- Most recent
- 2023
Recorded events, newest first
- October 2023 – Storm Babet18 to 22 Oct 2023 · 3 outlines · main river · channel capacity exceeded
- 2022 February Flood Incident – Storm Dudley, Eunice and Franklin20 Feb to 28 Mar 2022 · 6 outlines · main river, ordinary watercourse · channel capacity exceeded
- 2019 November Flood Incident7 to 8 Nov 2019 · 24 outlines · main river, ordinary watercourse · channel capacity exceeded
- June 200726 to 28 Jun 2007 · 1 outline · main river · channel capacity exceeded
- 2007 Beighton to Catcliffe – River Rother15 to 30 Jun 2007 · 2 outlines · main river · overtopping of defences
- 2007 Blackburn – Blackburn Brook15 to 30 Jun 2007 · 1 outline · main river · channel capacity exceeded
- 2007 Ecclesfield – Blackburn Brook15 to 30 Jun 2007 · 1 outline · main river · channel capacity exceeded
- 2007 Ecclesfield – Ecclesfield Brook15 to 30 Jun 2007 · 1 outline · main river · channel capacity exceeded
- 2007 River Don – Wadlesy Bridge to Philadelphia15 to 30 Jun 2007 · 1 outline · main river · channel capacity exceeded
- 2007 River Don Huthwaite15 to 30 Jun 2007 · 1 outline · main river · channel capacity exceeded
- 2007 River Don Oughtibridge to Wadsley Bridge15 to 30 Jun 2007 · 2 outlines · main river · channel capacity exceeded
- 2007 River Don Valley Development to Rawmarsh15 to 30 Jun 2007 · 1 outline · main river · channel capacity exceeded
- 2007 River Don Warncliffe Wood15 to 30 Jun 2007 · 1 outline · main river · channel capacity exceeded
- 2007 River Loxley Marlin Bridge15 to 30 Jun 2007 · 1 outline · main river · channel capacity exceeded
- 2007 River Rivelin15 to 30 Jun 2007 · 2 outlines · main river · channel capacity exceeded
- 2007 River Sheaf – Abbeydale15 to 30 Jun 2007 · 1 outline · main river · channel capacity exceeded
- 2007 River Sheaf Lowfields15 to 30 Jun 2007 · 1 outline · main river · channel capacity exceeded
- 2007 River Sheaf Millhouses15 to 30 Jun 2007 · 1 outline · main river · channel capacity exceeded
- 2007 River Sheaf Norton Hammer15 to 30 Jun 2007 · 1 outline · main river · channel capacity exceeded
- 2007 Stavley to Beighton15 to 30 Jun 2007 · 1 outline · main river · channel capacity exceeded
And 9 earlier events in the dataset.
June 2007 on the Don
On 25 June 2007 the Don rose through Sheffield after days of rain and the Agency later mapped where the water reached: 7 outlines along the river (River Don – Wadlesy Bridge to Philadelphia; River Don Huthwaite; River Don Oughtibridge to Wadsley Bridge), from Oughtibridge through Hillsborough and Neepsend to the Lower Don Valley, with the Sheaf, the Loxley, the Rivelin and Blackburn Brook recorded in the same fortnight. Today's river levels on the Local Map
Has this street flooded before? See the outlines on the Local Map · Recorded floods by neighbourhood
Recorded Flood Outlines, © Environment Agency copyright and/or database right 2025. Open Government Licence v3.0. Checked 12 Oct 2026. Recorded Flood Outlines dataset · All data sources
Mining Remediation Authority
Sheffield's coal legacy
The east of the city sits on the South Yorkshire coalfield, and centuries of pits, bell pits and shallow workings left shafts and seams close to the surface. The Mining Remediation Authority (formerly the Coal Authority) marks the places where recorded features could affect new building as Development High Risk Areas; planning applications there need a coal mining risk assessment. The rest of the coalfield is a low risk area.
- Share of the city's land
- 17.1%about 4,686 hectares
- High risk areas
- 507reaching a Sheffield neighbourhood
- Neighbourhoods touched
- 115of 147
Most covered neighbourhoods
- Stannington East and Deer Park · 69.9% of the landabout 104.0 hectares in a high risk area
- Devonshire Quarter · 67.4% of the landabout 15.8 hectares in a high risk area
- Saint Vincent's and Shalesmoor · 67.3% of the landabout 17.8 hectares in a high risk area
- High Green · 60.3% of the landabout 258.5 hectares in a high risk area
- Kelham / Kelham Island · 53.6% of the landabout 9.2 hectares in a high risk area
- Chapeltown · 51.5% of the landabout 241.4 hectares in a high risk area
- Middlewood · 50.2% of the landabout 66.6 hectares in a high risk area
- Halfway · 49.3% of the landabout 100.3 hectares in a high risk area
- Ecclesfield · 49.2% of the landabout 172.1 hectares in a high risk area
- Deepcar · 48.5% of the landabout 257.5 hectares in a high risk area
Shares are measured on a 50 metre grid from outlines simplified to about 20 metres, so read them as a guide. The Local Map can shade the areas and show recorded mine entries and coal outcrops. Open the Local Map
This is a planning designation drawn from recorded features, not a survey of any one property, and being in an area does not mean the ground there is unsafe. Buying or building? Ask the authority itself. Check if a property is affected by coal mining · Coal mining risk assessments for planning · Report a coal mine hazard (24 hours)
Contains Mining Remediation Authority data, Crown copyright, Open Government Licence v3.0. Checked 26 Oct 2026. Dataset: Coal mining Development High Risk Area · All data sources
ISS passes nearby
Closest approaches of the International Space Station to Sheffield in the next 48 hours. Night-time passes with the station sunlit are the ones worth stepping outside for; look towards the compass point given.
- Thu 29 Oct, 01:27, about 33° up to the S, 584 km away, night, station in shadow
- Thu 29 Oct, 04:40, about 45° up to the SW, 390 km away, night, station in shadow
- Thu 29 Oct, 06:17, about 18° up to the SW, 1,014 km away, night, station sunlit
- Fri 30 Oct, 00:40, about 25° up to the SE, 751 km away, night, station in shadow
- Fri 30 Oct, 02:16, about 56° up to the S, 266 km away, night, station in shadow
Aurora chance tonight
Green green, no significant activity. Planetary K index 1.67 at 03:00. AuroraWatch UK updated Wed 28 Oct, 07:54.
Stargazing tonight
- Wednesday night: mostly cloudy, about 97% cloud on average (best 97%), seeing average, transparency hazy
- Thursday night: mostly cloudy, about 97% cloud on average (best 97%), seeing average, transparency hazy
- Friday night: mostly cloudy, about 93% cloud on average (best 88%), seeing average, transparency clear
Earthquakes nearby
- M 2.6 Buttercrambe, N Yorks Mon 12 Oct, 11:42, 81 km from Sheffield
Protected land within reach
Natural England designations inside the Sheffield box, from the moors on the western edge to pockets of ancient woodland in the valleys.
- 67 sites of special scientific interest
- 1 national nature reserve
- 35 local nature reserves
- 583 ancient woodlands
- 652 areas of open access land
- 1 national park
About 43,300 hectares of open access land where you can walk freely under the right to roam.
Largest SSSIs: Dark Peak SSSI · Eastern Peak District Moors SSSI · Castleton SSSI · Dearne Valley Wetlands SSSI · The Wye Valley SSSI · Abney & Bretton Cloughs SSSI
Pollen and UV today
- Pollen: LowAll six pollen types low
- UV: Lowpeak index 0.7
- Air quality: FairEuropean AQI up to 33
- Tomorrowpollen low, UV low
British Geological Survey
The ground beneath Sheffield
Bedrock looked up at the centre of 147 neighbourhoods on the BGS 1:625 000 map: 135 on the Coal Measures (mudstone, siltstone, sandstone, coal, ironstone and ferricrete, Carboniferous); 12 on the Millstone Grit (the gritstone of the western moors and edges, Carboniferous).
- Pennine Lower Coal Measures Formation: mudstone, siltstone, sandstone, coal, ironstone and ferricrete, Carboniferous, Langsettian (Westphalian A), about 316 to 314 million years ago. 121 neighbourhoods (Lowedges, Batemoor, Jordanthorpe, …)
- Pennine Middle Coal Measures Formation: mudstone, siltstone, sandstone, coal, ironstone and ferricrete, Carboniferous, Duckmantian (Westphalian B) to Bolsovian (Westphalian C), about 314 to 309 million years ago. 14 neighbourhoods (Holbrook, Westfield, Waterthorpe, …)
- Millstone Grit Group: mudstone, siltstone and sandstone, Carboniferous, Namurian, about 327 to 316 million years ago. 12 neighbourhoods (Oughtibridge, Rivelin, Wharncliffe Side, …)
The 1:625 000 map is a regional overview generalised from more detailed sheets: it describes the ground under a neighbourhood as a whole and is not a site investigation. Radon potential is a licensed BGS and UKHSA product rather than open data, so it is left out here.
Contains British Geological Survey materials © UKRI 2026. Open Government Licence v3.0. Checked 10 Oct 2026. BGS Geology 625k bedrock · All data sources
Yorkshire Water via Stream
Sheffield reservoirs this week
Yorkshire Water's weekly readings for 11 reservoirs in the Sheffield catchment, week of 19 Oct 2026. The Rivelin and Redmires chains, the Loxley valley (Agden, Dale Dike, Strines), Broomhead on the Ewden and Langsett and Midhope on the Little Don. Damflask, Underbank and More Hall are not in the published set.
- All eleven together
- 30.5%6,947 of 22,775 thousand m³ stored
- Same week last year
- 38.9%week of 20 Oct 2025
- Fullest
- 94.7%Rivelin Upper
- Lowest
- 6.4%Redmires Middle
- Rivelin Upper · 94.7% full
94.7% full Rivelin · capacity 200 thousand m³ · week of 19 Oct · 39.5% this week last year - Rivelin Lower · 86.6% full
86.6% full Rivelin · capacity 616 thousand m³ · week of 19 Oct · 83.3% this week last year - Redmires Upper · 7.8% full
7.8% full Redmires · capacity 1,382 thousand m³ · week of 19 Oct · 23.6% this week last year - Redmires Middle · 6.4% full
6.4% full Redmires · capacity 769 thousand m³ · week of 19 Oct · 18.8% this week last year - Redmires Lower · 51.1% full
51.1% full Redmires · capacity 628 thousand m³ · week of 19 Oct · 33.4% this week last year - Agden · 51.1% full
51.1% full Loxley valley · capacity 2,902 thousand m³ · week of 19 Oct · 40.9% this week last year - Dale Dike · 36.0% full
36.0% full Loxley valley · capacity 2,049 thousand m³ · week of 19 Oct · 33.0% this week last year - Strines · 18.1% full
18.1% full Loxley valley · capacity 1,923 thousand m³ · week of 19 Oct · 41.2% this week last year - Broomhead · 20.9% full
20.9% full Ewden valley · capacity 4,937 thousand m³ · week of 19 Oct · 36.8% this week last year - Langsett · 21.3% full
21.3% full Little Don · capacity 5,492 thousand m³ · week of 19 Oct · 40.3% this week last year - Midhope · 52.2% full
52.2% full Little Don · capacity 1,877 thousand m³ · week of 19 Oct · 47.7% this week last year
These are context, not a notice. A low reservoir here does not mean a hosepipe ban and a full one does not rule one out: Yorkshire Water decides restrictions across its whole region and announces them itself. Saving water and any current restrictions · Yorkshire Water announcements · Visiting the reservoirs
Reservoir levels: Yorkshire Water, published on Stream, CC BY 4.0. Checked 26 Oct 2026. Dataset: Yorkshire Water Reservoir Levels 2026 · All data sources
Forestry Commission, National Forest Inventory
Sheffield's woods
The National Forest Inventory maps every wood of half a hectare or more in England from aerial photography. Its 2025 release counts 4,080 ha of woodland in 980 parcels inside Sheffield, about 14.8% of the city's land.
- Woodland
- 4,080 ha980 parcels
- Share of the city
- 14.8%of the land inside the neighbourhoods
- Broadleaved
- 73%of the woodland
- Felled or being replanted
- 233 hafelled, blown down or prepared for planting
What kind of woodland
- Broadleaved · 2,990 ha · 73.3%oak, birch, beech, ash and other trees that drop their leaves
- Conifer · 627 ha · 15.4%pine, larch, spruce and other needle trees, mostly planted
- Mixed · 94 ha · 2.3%broadleaved and conifer trees growing together
- Young trees · 58 ha · 1.4%newly planted or regrowing, not yet a closed canopy
- Felled or being replanted · 233 ha · 5.7%recently felled, blown down or ground prepared for planting
- Other woodland · 78 ha · 1.9%coppice, scrub, sparse trees and parcels the survey assumes are woodland
The largest woods
- Wharncliffe Wood · 374 ha51% broadleaved · Wharncliffe Side, Bradfield, Ewden and Bolsterstone · 62 parcels
- Greno Woods · 277 ha58% broadleaved · Grenoside, Burncross, High Green · 24 parcels
- Ecclesall Woods · 201 hamostly broadleaved · Whirlow, Millhouses, Ringinglow · 12 parcels
- Hesley and Thorncliffe Woods · 200 hamostly broadleaved · High Green, Chapeltown · 14 parcels
- Fox Hagg and Rivelin Rough · 172 ha74% broadleaved · Rivelin, Lodge Moor, Bradfield · 16 parcels
- Woodland near Bradfield · 164 hamostly conifer · Bradfield · 15 parcels
- Ewden valley plantations · 132 ha53% broadleaved · Bradfield · 32 parcels
- Beeley Wood · 108 hamostly broadleaved · Oughtibridge, Wadsley Bridge · 5 parcels
- Hagg and Reaps Woods · 98 hamostly broadleaved · Rivelin, Lodge Moor · 9 parcels
- Oak Wood, Stocksbridge · 75 ha55% broadleaved · Stocksbridge, Midhopestones · 10 parcels
Parcels that touch are counted as one wood, and a parcel counts as Sheffield's when its centre falls inside a Sheffield neighbourhood, so a wood on the city edge can be counted in part. The inventory carries no names: the names here are ours, added from the map. Every wood by type on the Local Map
National Forest Inventory: © Forestry Commission copyright. Contains Ordnance Survey data © Crown copyright and database right 2026. Open Government Licence v3.0. Checked 12 Oct 2026. Dataset: National Forest Inventory England 2025 · All data sources
Ordnance Survey, OS Open Greenspace
Pitches, courts and greens near you
Ordnance Survey maps 100 allotment sites, 54 bowling greens, 49 tennis court sites, 117 playing fields and 163 play spaces inside Sheffield, with 1,186 gates and entrances into them. Parks are on the parks page, from the council's own layer.
- Allotments and community growing spaces
- 100
- Bowling greens
- 54
- Tennis courts
- 49
- Playing fields
- 117
- Golf courses
- 13
- Play spaces
- 163
- Other sports grounds
- 145
- Gates and entrances
- 1,186
Allotments and community growing spaces
- Aldene Road Allotment GardensWisewood · 1.9 ha · 2 entrances
- Archer Lane Allotment Home and Garden SocietyCarterknowle / Carter Knowle · 3.5 ha · 5 entrances
- Belmont Avenue Allotment GardensChapeltown · 0.1 ha · 1 entrance
- Bolehill Quarry Allotment GardensCrookes · 0.4 ha
- Bracken Moor Allotments SiteStocksbridge · 0.3 ha · 1 entrance
- Brushes Allotment GardensGrimesthorpe · 0.7 ha · 1 entrance
- Burncross Road Allotment GardensChapeltown · 0.6 ha · 1 entrance
- Corker Bottoms Lane Allotment GardensManor / Manor Lodge / Manor Top · 1.8 ha · 1 entrance
- Crookes Marsh Lane Allotment GardensCrookes · 1.5 ha · 3 entrances
- Crookes Quarry Allotment GardensCrookes · 1.3 ha · 1 entrance
- Cross Hill Allotment GardensEcclesfield · 1.2 ha · 10 entrances
- Ecclesall Allotment GardensEcclesall · 0.5 ha · 1 entrance
- Edgefield Road Allotment GardensNether Edge · 0.3 ha · 1 entrance
- Elm Crescent Allotment GardensMosborough · 0.5 ha · 1 entrance
- Ferncroft Avenue Allotment GardensMosborough · 0.2 ha · 1 entrance
- Finchwell Road Allotment GardensHandsworth · 0.9 ha · 2 entrances
- Francis Fields Allotment GardensTotley · 0.8 ha · 1 entrance
- Grimesthorpe AllotmentsOsgathorpe · 3.8 ha · 2 entrances
- Hagg Lane AllotmentsCrosspool · 5.7 ha · 8 entrances
- Handras AllotmentsHandsworth · 3.9 ha · 3 entrances
- Hangingwater Road Allotment GardensNether Green / Hangingwater · 3.2 ha · 5 entrances
- Harris Road Allotment GardensWadsley · 0.9 ha · 1 entrance
- Hawthorne Avenue AllotmentStocksbridge · 0.1 ha · 1 entrance
- Heeley Allotment GardensHeeley / Heeley Green · 0.9 ha · 1 entrance
- Herdings View Allotment GardensHerdings · 2.5 ha · 2 entrances
- High Storrs AllotmentBents Green · 2.2 ha · 5 entrances
- Highcliffe Road Allotment GardensHigh Storrs · 1.6 ha · 3 entrances
- Holberry Gardens Allotment GardensBroomhall · 0.2 ha · 1 entrance
- Hollinsend Allotment GardensHollinsend · 0.2 ha
- Hollinsend Recreation Ground Allotment GardensBase Green · 1.0 ha · 1 entrance
- Infield Lane Allotment GardensDarnall · 5.8 ha · 3 entrances
- Lambcroft Allotment GardensWoodhouse · 1.2 ha · 3 entrances
- Longley Allotment GardensLongley · 2.2 ha · 2 entrances
- Malin Bridge AllotmentMalin Bridge · 0.5 ha · 2 entrances
- Manor Allotment GardensManor / Manor Lodge / Manor Top · 2.3 ha · 1 entrance
- Meersbrook Allotment GardensMeersbrook · 15 ha · 4 entrances
- Mickley Lane AllotmentTotley · 0.9 ha · 1 entrance
- Moor Crescent Allotment GardensMosborough · 0.1 ha · 1 entrance
- Morley Street AllotmentWalkley · 5.0 ha · 10 entrances
- Morley Street Gas AllotmentHillsborough · 1.8 ha · 4 entrances
- Moss Way Allotment GardensMosborough · 2.5 ha · 1 entrance
- Mouse Hole Forge Allotment GardensMalin Bridge · 0.3 ha · 1 entrance
- Norton Lees Allotment GardensMeersbrook · 1.8 ha · 1 entrance
- Norton St Pauls Allotment GardensMeersbrook · 0.7 ha · 1 entrance
- Norwood Allotment GardensOsgathorpe · 1.5 ha · 2 entrances
- Orchard Lane Allotment GardensBeighton · 3.6 ha · 4 entrances
- Ouse Road Allotment GardensDarnall · 0.6 ha · 2 entrances
- Oxley Park Allotment GardensStocksbridge · 0.2 ha · 1 entrance
- Park Rifles Allotment GardensWybourn · 1.2 ha · 2 entrances
- Plumbley Lane Allotment GardensMosborough · 0.7 ha · 4 entrances
- Richmond AllotmentRichmond · 0.3 ha · 1 entrance
- Rivelin Park Road Allotment GardensRivelin / Rivelin Valley · 0.2 ha · 2 entrances
- Rodney Hill Allotment GardensLoxley / Loxley Valley · 3.1 ha · 1 entrance
- Roscoe Bank Allotment GardensRivelin / Rivelin Valley · 0.7 ha · 1 entrance
- Roscoe Plantation Allotment GardensRivelin / Rivelin Valley · 4.8 ha · 11 entrances
- Rustlings Road Allotment GardensGreystones · 1.4 ha · 1 entrance
- Sharrard Road Allotment GardensIntake · 1.7 ha · 2 entrances
- Shirecliffe Allotment GardensShirecliffe · 1.5 ha · 1 entrance
- Soap House Lane Allotment GardensWoodhouse · 1.2 ha · 2 entrances
- Sothall Green Allotment GardensBeighton · 0.4 ha · 1 entrance
- Stanley Road Allotment GardensStocksbridge · 0.6 ha · 2 entrances
- Stubbin Allotment GardensFirth Park · 1.0 ha · 2 entrances
- The Hagg Allotment GardensRivelin / Rivelin Valley · 5.4 ha · 5 entrances
- Truman Grove Allotment GardensDeepcar · 0.2 ha · 1 entrance
- Tye Road Allotment GardensBeighton · 0.2 ha · 1 entrance
- Vicarage Lane Allotment GardensDore · 0.6 ha · 1 entrance
- Vickers Road Allotment GardensFirth Park · 0.8 ha · 1 entrance
- Victoria Road Allotment GardensBeighton · 0.8 ha · 4 entrances
- Victoria Road AllotmentsWoodhouse · 2.6 ha · 3 entrances
- Walkley Bank Plantation Allotment GardensRivelin / Rivelin Valley · 1.0 ha · 1 entrance
- Warminster Road AllotmentNorton Lees · 0.1 ha · 1 entrance
- Warminster Road Allotment GardensNorton Lees · 1.1 ha · 3 entrances
- Wellcarr Road Allotment GardensWoodseats · 1.4 ha · 1 entrance
- Windmill Lane Allotment GardensFirth Park · 3.2 ha · 2 entrances
- Woodland View Allotment SocietyStannington East and Deer Park · 0.9 ha · 2 entrances
- Woodseats Allotment GardensBeauchief · 5.9 ha · 5 entrances
24 more allotment sites have no name on the map. Plots are let by the council or by each site's own association; ask the site for its waiting list.
Neighbourhoods with the most pitches, courts and greens
- Fulwood2 bowling greens, 8 tennis court sites, 1 play space
- Stocksbridge6 playing fields, 2 bowling greens, 2 tennis court sites, 6 allotment sites, 4 play spaces
- Darnall5 playing fields, 1 bowling green, 1 tennis court site, 2 allotment sites, 3 play spaces
- Millhouses1 playing field, 1 bowling green, 5 tennis court sites, 3 play spaces
- Firth Park3 playing fields, 2 bowling greens, 4 allotment sites, 1 play space
- Shiregreen2 playing fields, 1 bowling green, 1 tennis court site, 1 play space
- Totley4 playing fields, 1 bowling green, 1 tennis court site, 2 allotment sites, 2 play spaces
- Ecclesfield1 playing field, 2 bowling greens, 4 allotment sites, 1 play space
Allotments, greens, courts and pitches on the Local Map · Gates and entrances · Parks
Contains OS data © Crown copyright and database right 2026. OS Open Greenspace, Open Government Licence v3.0. Checked 12 Oct 2026. Dataset: OS Open Greenspace, 2026-04 release · All data sources
Global Meteor Network · UK Meteor Network
Meteors over Sheffield this week
Cameras of the UK Meteor Network, part of the Global Meteor Network, triangulated 112 meteors that began or ended within 65 km of Sheffield in the seven nights to 26 Oct: 48 from known showers, the rest sporadic. The brightest, at 04:37 on 24 Oct, reached absolute magnitude -2.6.
- Meteors
- 112
- From showers
- 48
- Sporadic
- 64
- Brightest (magnitude)
- -2.6
- Fireballs
- 0
Showers seen
- Orionids (ORI)28 meteors
- Southern Taurids (STA)5 meteors
- Leonis Minorids (LMI)4 meteors
- epsilon Geminids (EGE)2 meteors
- Shower NUE2 meteors
- Shower OAT2 meteors
- Shower CTA1 meteor
- Shower NOA1 meteor
- Shower OCH1 meteor
- Shower OER1 meteor
- Shower XAR1 meteor
The brightest
- Sat 24 Oct, 04:37: Orionids (ORI)magnitude -2.6 · 114 km to 93 km up · 66.6 km/s · 2 cameras
- Sun 25 Oct, 22:05: Sporadicmagnitude -2.6 · 116 km to 85 km up · 63.0 km/s · 2 cameras
- Thu 22 Oct, 04:34: Sporadicmagnitude -2.6 · 105 km to 81 km up · 46.8 km/s · 5 cameras
- Fri 23 Oct, 03:38: epsilon Geminids (EGE)magnitude -2.5 · 111 km to 95 km up · 69.2 km/s · 2 cameras
- Fri 23 Oct, 23:55: Orionids (ORI)magnitude -2.4 · 116 km to 98 km up · 67.4 km/s · 14 cameras
Magnitudes are absolute (as if the meteor were 100 km overhead); lower is brighter, and -4 or brighter is a fireball. A night under cloud shows none. Ground tracks on the Local Map
Meteor trajectories from the Global Meteor Network, with cameras of the UK Meteor Network, CC BY 4.0 CC BY 4.0. Checked 28 Oct 2026. Global Meteor Network data · UK Meteor Network · All data sources
Heritage and culture 3 cards
Protected heritage
The National Heritage List records 4,449 listed buildings around Sheffield: 70 at Grade I, 252 at Grade II* and 4,127 at Grade II.
- 🏛️ 4,449 listed buildings
- 🗿 358 scheduled monuments covering 1,014.9 hectares
- 🌳 30 registered parks and gardens covering 2,750.2 hectares
- Sheffield has none of the remaining designation types the list holds: no registered battlefields, protected wreck sites or World Heritage Sites.
Grade I on the list: Administration Building at Monk Bretton Priory · Barlborough Hall · Baslow Bridge · Bolsover Castle · Bridge on Main Approach to Chatsworth House · Brodsworth Hall · Chapel of Our Lady · Chatsworth House
Sheffield museums and galleries
19 museums and galleries inside the city, from the trust sites to the one-room volunteer collections, and 24 more just outside it.
 Abbeydale Industrial HamletTh-Sa 10:00-17:00; Su 11:00-16:00
- Alfred Denny MuseumSa[1] 10:00-12:00
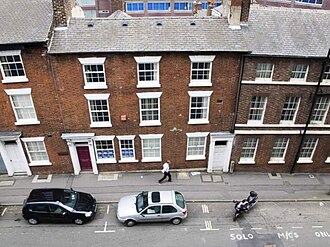 Bank Street Arts
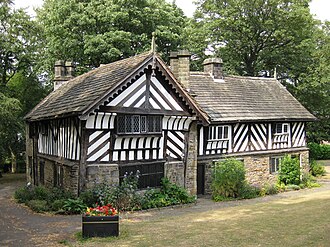 Bishops' HouseSa,Su 10:00-16:00
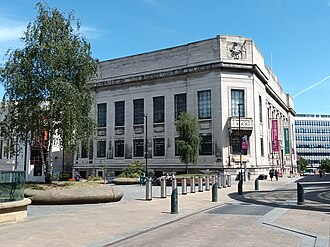 Graves Art GalleryTu-Sa 11:00-16:00; We 13:00-18:00; PH off
- Handsworth St Marys Museum
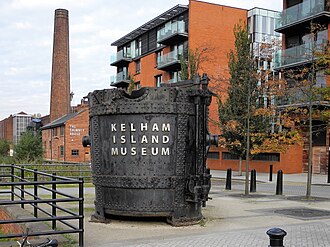 Kelham Island MuseumTu-Sa 10:00-16:00; Su 11:00-16:00
- Ken Hawley CollectionTu-Sa 10:00-16:00; Su 11:00-16:00; Mo off
- Legends of the Lane
 Mappin Art Gallery
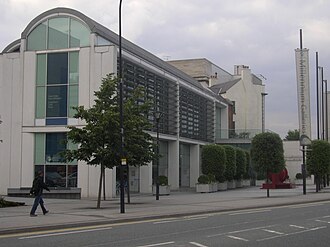 Millennium GalleryTu-Sa 10:00-17:00; Su 11:00-16:00
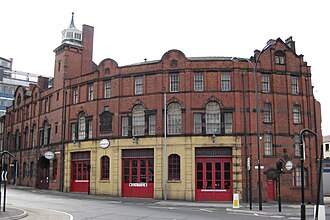 National Emergency Services MuseumWe-Su 10:00-16:00; Mo,Tu off
Canal & River Trust
Walk the Sheffield and Tinsley Canal
The Trust's asset register places 11 locks, 30 bridges and 8 pipe crossings along the canal between Victoria Quays in the city centre and the top of the Tinsley flight, about four miles of towpath. The locks are all at the Tinsley end, where the canal climbs from the River Don; the walk from the basin is flat until then.
- Locks to climb
- 11
- Bridges to pass
- 30
- Pipe crossings
- 8
- Wharves, weirs and slipways
- 3
The Tinsley flight
- Lock 1 TinsleyLock · FT-005-002
- Tinsley No.2 LockLock · FT-005-005
- Tinsley No.3 LockLock · FT-005-007
- Tinsley No.4 LockLock · FT-005-010
- Tinsley No.5 LockLock · FT-005-011
- Tinsley No.6 LockLock · FT-005-013
- Tinsley No.7/8 (Deep) LockLock · FT-005-017
- Tinsley No.9 (Plumpers) LockLock · FT-006-002
- Tinsley No.10 (Wharf Road) LockLock · FT-006-007
- Tinsley No.11 LockLock · FT-007-001
- Tinsley No.12 LockLock · FT-007-002
Bridges from Victoria Quays to Tinsley
- Sheffield Basin Swing BridgeTowpath or swing bridge · FT-001-006
- Site Of Old Railway BridgeRemains of a former bridge · FT-001-007
- Sheffield Inner Ring Road BridgeRoad bridge · FT-001-008
- Sheffield Victoria Railway ViaductRailway bridge · FT-001-009
- Bridge 3, Cadman Street BridgeRoad bridge · FT-001-013
- Midland Railway Bridge 4Railway bridge · FT-001-014
- Sheffield Bernard Road Bridge 5Road bridge · FT-001-015
- Footbridge over Drydock GatesFootbridge · FT-001-032-01
- Cadman Street Gas Pipe BridgePipe crossing · FT-001-050
- Bacon Lane BridgeRoad bridge · FT-002-001
- Attercliffe Footbridge 6AFootbridge · FT-002-002
- Attercliffe Staniforth Rd Bridge 7Road bridge · FT-003-001
- Supertram Bridge 7ARailway bridge · FT-003-002
- Supertram Footbridge 7BFootbridge · FT-003-003
- Attercliffe Shirland Lane FootbridgeFootbridge · FT-003-004
- Attercliffe Shirland Lane Bridge 8Road bridge · FT-003-005
- Attercliffe FootbridgeFootbridge · FT-003-006
- Attercliffe Railway Bridge 9Railway bridge · FT-003-007
- Brown Bayley Bridge 10AFootbridge · FT-004-001
- Tinsley Coleridge Road Bridge 11Road bridge · FT-004-002
- And 18 more, all on the map. Local Map
Wharf, weir and slipway
- Sheffield Basin WharfWharf · FT-001-001
- Fixed Overflow WeirOverflow weir · FT-006-006
- Sheffield Boatyard SlipwaySlipway · FT-001-012
The Sheffield and Tinsley Canal on the Canal & River Trust site · Every lock and bridge on the Local Map
Lock, bridge, wharf, weir and slipway locations from the Canal & River Trust asset register, published on the Trust's open data hub under the Open Government Licence v3.0. Open Government Licence v3.0. Checked 26 Oct 2026. The dataset on the Trust's open data hub · All data sources
Council and democracy 5 cards
Council data for this city
Sheffield City Council publishes these layers under the Open Government Licence; each is on the Local Map and on the neighbourhood pages.
- 1,018Community forestry trees
- 59Historic parks and gardens
- 11320 mph zones
- 54School crossing patrols
- 3,027Litter bins on the highway
- 163Sheffield Local Heritage List
- 223Polling stations
Most planted community forestry species: Quercus robur (64), Tilia cordata (57), Platanus x hispanica (35).
9 further Council layers are published only under terms that do not allow reuse here; the sources page lists them. Sources
Planning
Recent planning applications
- Undecided196 – 198 Shirebrook Road Sheffield S8 9RG
- UndecidedClarence Villa 32 Crescent Road Sheffield S7 1HN
- Undecided33 Parkers Road Sheffield S10 1BN
- UndecidedLand Between 5 And 21 Holmhirst Road Sheffield S8 0GU
- Undecided160 Osborne Road Sheffield S11 9BB
- Undecided10 Woodvale Road Sheffield S10 3EX
- UndecidedFlat 4 Ivy Park Court 35 Ivy Park Road Sheffield S10 3LA
- Undecided92 Tom Lane Sheffield S10 3PD
Every recent application on the Sheffield map · Search all Sheffield applications on UK PlanIt
Planning applications: UK PlanIt, aggregated from Sheffield City Council. Check the council record before relying on any detail; documents are linked, never copied. UK PlanIt · All data sources
Planning constraints
Conservation areas in Sheffield
39 conservation areas touch Sheffield (32 designated by Sheffield City Council, 4 designated by Peak District National Park Authority). Each one is an area of special architectural or historic interest, so changes to buildings, trees and frontages need extra care and often permission.
- Beauchief Abbey
- Beauchief Hall
- Birkendale
- Bolsterstone
- Bradfield
- Brightholmlee
- Broomhall
- Broomhill
- City Centre
- Cultural Industries Quarter
- Dore
- Ecclesfield
- Endcliffe
- Fulwood
- Furnace Hill
- General Cemetery
- Greenhill
- Grenoside
- Hackenthorpe
- Hanover
- Hillsborough Park
- John Street
- Kelham Island and Neepsend
- Langsett
- Middlewood Park
- Midhopestones
- Moss Valley
- Nether Edge
- Norfolk Road
- Northumberland Road
- Norton
- Oakes Park
- Porter Brook
- Ranmoor
- Totley
- Upper Midhope
- Wadsley
- Well Meadow
- Whirlow
The city's brownfield land register holds 667 sites over 357.7 hectares; the biggest are on the housing page. Brownfield land
Contains planning.data.gov.uk data published by Sheffield City Council and neighbouring planning authorities under the Open Government Licence v3.0; conservation area boundaries © Historic England, containing Ordnance Survey data © Crown copyright and database right. Open Government Licence v3.0. Checked 10 Oct 2026. planning.data.gov.uk · All data sources
Valuation Office Agency
What council tax band are Sheffield's homes in?
At 31 March 2026 Sheffield had 263,810 homes on the council tax list. 153,020 of them (58%) are in Band A, the lowest band, against 24% across England. Bands rest on what a home would have sold for in April 1991, so they say more about the age and type of the housing than about today's prices. Across that mix the average full bill before discounts comes to about £1,959 a year in 2026-27, worked out from the Band D figure.
- Homes
- 263,810
- Band A
- 58%
- Band B
- 16%
- Band C
- 13%
- Bands D to H
- 13%
Homes in each band
- Band A: 153,020 homes (58.0%)Valued up to £40,000 in 1991 · £1,673.44 full bill, 2026-27
- Band B: 42,910 homes (16.3%)Valued £40,001 to £52,000 in 1991 · £1,952.35 full bill, 2026-27
- Band C: 33,550 homes (12.7%)Valued £52,001 to £68,000 in 1991 · £2,231.25 full bill, 2026-27
- Band D: 16,950 homes (6.4%)Valued £68,001 to £88,000 in 1991 · £2,510.16 full bill, 2026-27
- Band E: 9,840 homes (3.7%)Valued £88,001 to £120,000 in 1991 · £3,067.97 full bill, 2026-27
- Band F: 4,420 homes (1.7%)Valued £120,001 to £160,000 in 1991 · £3,625.79 full bill, 2026-27
- Band G: 2,900 homes (1.1%)Valued £160,001 to £320,000 in 1991 · £4,183.60 full bill, 2026-27
- Band H: 220 homes (0.1%)Valued over £320,000 in 1991 · £5,020.32 full bill, 2026-27
Neighbourhoods where most homes are Band A
- Shiregreen
99% Band A 99% of about 3,830 homes in Band A - Hyde Park
99% Band A 99% of about 830 homes in Band A - Lowedges / Low Edges
99% Band A 99% of about 2,320 homes in Band A - Batemoor
98% Band A 98% of about 850 homes in Band A - Wybourn
97% Band A 97% of about 1,370 homes in Band A - Hemsworth
97% Band A 97% of about 2,020 homes in Band A - Arbourthorne
97% Band A 97% of about 2,690 homes in Band A - Burngreave
97% Band A 97% of about 2,140 homes in Band A
Neighbourhoods with the fewest Band A homes
- Parkhead
0% Band A 0% of about 670 homes in Band A - High Storrs
0% Band A 0% of about 600 homes in Band A - Ecclesall
1% Band A 1% of about 1,340 homes in Band A - Fulwood
1% Band A 1% of about 1,280 homes in Band A - Whirlow
2% Band A 2% of about 680 homes in Band A
Band A share by neighbourhood on the Local Map
Council tax stock of properties (table CTSOP1.1) from the Valuation Office Agency, Open Government Licence v3.0 Open Government Licence v3.0. Checked 12 Oct 2026. Valuation Office council tax statistics · Background notes · All data sources
Money and energy 3 cards
Cheapest petrol and diesel near you
17 forecourts across Sheffield with prices submitted in the last week through Fuel Finder. Pence per litre.
Unleaded (E10)
- 167.9p Cecil Penney Ltd cecil penney ltd, SHEFFIELD S36 6HF
- 169.9p Sainsbury's SAINSBURYS ARCHER ROAD, SHEFFIELD S8 0TD
- 169.9p Morrisons MFG MORRISONS SHEFFIELD MEADOWHEAD, SHEFFIELD S8 7UE
- 169.9p Esso MFG BRADWAY, SHEFFIELD S17 4QW
- 169.9p Gulf Petrol Station Renishaw Service Station, SHEFFIELD S21 3WF
- 171.9p Esso MFG BANNER CROSS, SHEFFIELD S11 8TP
- 171.9p Total Harvest Energy Coal Aston EG COAL ASTON PFS, SHEFFIELD S18 3AA
- 171.9p Esso CHAPELTOWN ESSO EXPRESS, SHEFFIELD S35 1SA
Diesel (B7)
- 197.9p Esso MFG BRADWAY, SHEFFIELD S17 4QW
- 199.9p Shell SHELL WAITROSE SHEFFIELD, SHEFFIELD S2 4QF
- 200.9p Shell Carlisle Street SHELL CARLISLE STREET, SHEFFIELD S4 7LJ
Office for National Statistics via Nomis
Sheffield economy in numbers
Official labour market statistics for Sheffield as a local authority, each dated to the release it comes from. The claimant count is the number of people on Universal Credit or Jobseeker's Allowance who are required to look for work; it is not the unemployment rate, which is a survey estimate.
- People claiming unemployment-related benefits
- 16,785Sep 2026, 4.4% of residents aged 16 to 64 · data
- Enterprises based in Sheffield
- 20,695UK Business Counts 2026 · data
- Jobs in Sheffield
- 272,000BRES 2024, employees and working owners · data
- Median weekly pay, full-time workers
- £733ASHE 2025, gross, by workplace · data
- Employment rate, aged 16 to 64
- 73.3%APS, Jul 2025-Jun 2026 · data
Enterprises by size, 2026
- Micro (0 to 9 employees)16,700 · 80.7%
- Small (10 to 49)3,185 · 15.4%
- Medium-sized (50 to 249)715 · 3.4%
- Large (250 and more)100 · 0.5%
Where the jobs are, 2024
- Education32,000 jobs · 11.8%
- Human health activities32,000 jobs · 11.8%
- Retail trade, except of motor vehicles and motorcycles22,000 jobs · 8.1%
- Public administration and defence; compulsory social security20,000 jobs · 7.4%
- Food and beverage service activities18,000 jobs · 6.6%
- Wholesale trade, except of motor vehicles and motorcycles11,000 jobs · 4.0%
- Employment activities9,000 jobs · 3.3%
- Specialised construction activities7,000 jobs · 2.6%
Employment by SIC 2007 division from the Business Register and Employment Survey, rounded by the ONS; the share is of all jobs in the city.
Claimant count by ward, Sep 2026
Across Sheffield 4.4% of residents aged 16 to 64 were claiming in Sep 2026. Wards are the May 2025 electoral wards; their series begins in January 2026.
- Burngreave9.7% · 1,825 claimants
- Darnall7.8% · 1,185 claimants
- Firth Park6.9% · 1,030 claimants
- Manor Castle6.3% · 1,040 claimants
- Park and Arbourthorne6.2% · 800 claimants
- Gleadless Valley6.1% · 855 claimants
- Shiregreen and Brightside6.0% · 810 claimants
- Beauchief and Greenhill5.9% · 715 claimants
- Southey5.9% · 800 claimants
- Nether Edge and Sharrow5.4% · 985 claimants
- Woodhouse (Sheffield)4.8% · 555 claimants
- Walkley4.5% · 810 claimants
- Richmond (Sheffield)4.3% · 495 claimants
- Hillsborough3.6% · 460 claimants
- Mosborough3.2% · 345 claimants
- Broomhill and Sharrow Vale3.1% · 535 claimants
- City (Sheffield)3.1% · 845 claimants
- Birley3.0% · 325 claimants
- Stocksbridge and Upper Don3.0% · 335 claimants
- Stannington2.8% · 315 claimants
- West Ecclesfield2.8% · 285 claimants
- Beighton2.6% · 290 claimants
- East Ecclesfield2.6% · 285 claimants
- Graves Park2.0% · 225 claimants
- Dore and Totley1.7% · 175 claimants
- Ecclesall1.5% · 180 claimants
- Crookes and Crosspool1.3% · 155 claimants
- Fulwood1.1% · 135 claimants
Source: Office for National Statistics licensed under the Open Government Licence v3.0, via Nomis. Ward boundaries from ONS Open Geography, OGL v3.0. Checked 26 Oct 2026. Claimant count on Nomis · Nomis · All data sources
Sport and facilities 1 card
Where Sheffield plays
Sport England count 739 operational facilities across 278 Sheffield sites: pitches, pools, courts, halls and gyms. 59 of those sites let anyone turn up and pay to play.
- ⚽ 323 Grass Pitches
- 🏐 96 Sports Hall
- 🥅 66 Artificial Grass Pitch
- 🏋️ 66 Health and Fitness Gym
- 🤸 61 Studio
- 🎾 51 Outdoor Tennis Courts
- 🏊 27 Swimming Pool
- 🎾 14 Padel
- Abbeydale Sports Club Ltd
- Forge Valley School
- Hinde House School
- Sheffield Hallam University Sports Park
- CATCH Market
- Goodwin Sports Centre
- Graves Tennis and Leisure Centre
- Endcliffe Park
- Handsworth Grange Community Sports Centre
- The Birley Academy
53 of these are already in the Sheffield Events directory, so their class timetables and their facilities sit on one page.
Community 2 cards
Around here
Everyday places mapped across Sheffield by OpenStreetMap volunteers and the Toilet Map. Each neighbourhood page shows the ones inside its boundary.
Ofsted management information
School inspections in Sheffield
Ofsted lists 178 state-funded schools in Sheffield as at 30 Sep 2026. 22 have a report card under the renewed framework that began in November 2025, which grades each area from exceptional to urgent improvement and says whether safeguarding is met; the rest carry their last inspection under the previous framework, a 1 to 4 grade or an ungraded outcome. Each school links to its reports on the Ofsted site.
- Schools
- 178
- Report cards
- 22
- Safeguarding met
- 22
- Graded Good or Outstanding (newest record)
- 53
- In a category of concern
- 3
Recently inspected
- Primary Meersbrook Bank Primary SchoolReport card: safeguarding met; strong standard 3, expected standard 4 · inspected 14 Jul 2026, published 29 Sep 2026
- Primary Hillsborough Nursery & Primary SchoolReport card: safeguarding met; strong standard 1, expected standard 6 · inspected 9 Jun 2026, published 24 Sep 2026
- Primary Wisewood Nursery & Primary SchoolReport card: safeguarding met; strong standard 3, expected standard 4 · inspected 30 Jun 2026, published 22 Sep 2026
- Secondary Newfield Secondary SchoolReport card: safeguarding met; strong standard 2, expected standard 4 · inspected 23 Jun 2026, published 14 Sep 2026
- Primary Sacred Heart School, A Catholic Voluntary AcademyReport card: safeguarding met; strong standard 3, expected standard 4 · inspected 14 Jul 2026, published 14 Sep 2026
- Primary Bankwood Primary SchoolReport card: safeguarding met; every area expected standard · inspected 9 Jun 2026, published 8 Sep 2026
- Special Kingfisher AcademyReport card: safeguarding met; every area strong standard · inspected 16 Jun 2026, published 8 Sep 2026
- Primary Netherthorpe Primary SchoolReport card: safeguarding met; expected standard 4, needs attention 3 · inspected 23 Jun 2026, published 8 Sep 2026
Colleges and training providers
- General further education colleges The Sheffield CollegeGraded inspection: Good · inspected 6 Dec 2022
- Independent learning providers CTS TrainingGraded inspection: Good · inspected 14 Aug 2024
- 16 to 19 academies Chapeltown AcademyGraded inspection: Good · inspected 26 Sep 2018, short inspection 23 Oct 2024
- Independent learning providers EnvisageGraded inspection: Good · inspected 6 Mar 2019, short inspection 6 Feb 2025
- Independent specialist colleges Freeman CollegeGraded inspection: Good · inspected 6 Mar 2024
- 16 to 19 academies Longley Park Sixth Form AcademyGraded inspection: Good · inspected 3 Oct 2018, short inspection 3 Oct 2024
- Employer providers Momentum Recruitment LimitedGraded inspection: Good · inspected 30 Jan 2024
- Independent learning providers Realise Learning and Employment LimitedGraded inspection: Good · inspected 11 Jul 2023
Inspection outcomes from Ofsted management information on state-funded schools and further education and skills providers, Open Government Licence v3.0. Checked 26 Oct 2026. School inspection management information · FE and skills management information · All data sources
More 4 cards
Recorded crime in Sheffield, August 2026
South Yorkshire Police recorded 7,501 offences across the city in August 2026, the most recent whole month the Home Office has published. Crime data comes out about two months in arrears, so this is not a picture of today.
These are counts for a neighbourhood, not for a street or a home. The locations the Home Office publishes are anonymous map points that stand for a stretch of street, so no figure here says where anything happened, and none of them is stored on this site.
| Offence type | Recorded | Share of all crime |
|---|---|---|
| Violence and sexual offences | 2,448 | 32.6% |
| Anti-social behaviour | 1,317 | 17.6% |
| Shoplifting | 1,002 | 13.4% |
| Criminal damage and arson | 570 | 7.6% |
| Public order | 530 | 7.1% |
| Other theft | 366 | 4.9% |
| Vehicle crime | 363 | 4.8% |
| Burglary | 279 | 3.7% |
| Neighbourhood | Offences recorded | Most recorded type |
|---|---|---|
| City Centre | 249 | Violence and sexual offences |
| Cathedral Quarter | 136 | Violence and sexual offences |
| Woodhouse | 132 | Violence and sexual offences |
| Darnall | 115 | Violence and sexual offences |
| The Moor | 110 | Shoplifting |
| Hillsborough | 109 | Violence and sexual offences |
| Southey | 109 | Violence and sexual offences |
| Tinsley | 105 | Violence and sexual offences |
A busy city-centre neighbourhood records more offences than a quiet residential one partly because far more people are in it. These are counts, not rates, and they are not a ranking of how safe anywhere is to live.
1,700 offences fell outside every neighbourhood boundary and are counted in the city total only.
Recorded crime by neighbourhood on the map · The force's own crime map
What people are reporting to the council
1,650 problems were reported to Sheffield City Council through FixMyStreet in the last 30 days, across 136 neighbourhoods.
These are reports, not findings. Somebody saw something and told the council about it through FixMyStreet. A report can be mistaken, a duplicate of another, or already dealt with, and the status beside it is the status FixMyStreet holds rather than a statement about the street today.
| What was reported | Reports in 30 days | Share |
|---|---|---|
| Fly tipping and rubbish | 679 | 41.2% |
| Parking and vehicles | 441 | 26.7% |
| Roads and potholes | 170 | 10.3% |
| Trees, parks and grass | 141 | 8.5% |
| Pavements and paths | 83 | 5% |
| Something else | 79 | 4.8% |
| Graffiti and damage | 30 | 1.8% |
| Street lighting | 17 | 1% |
| Signs, bins and street furniture | 10 | 0.6% |
FixMyStreet answers with the newest 1,000 reports and no more, so the figures above are at least that many rather than the exact total.
Of the 2,000 reports held here, 1,945 are still marked open on FixMyStreet (97%) and 0 are marked fixed. A report stays open until somebody marks it otherwise, so an open report is not proof that nothing was done, and a report whose status changed after it dropped out of the feed still reads as it did then.
Reported problems on the map · Report something, or read the reports on FixMyStreet