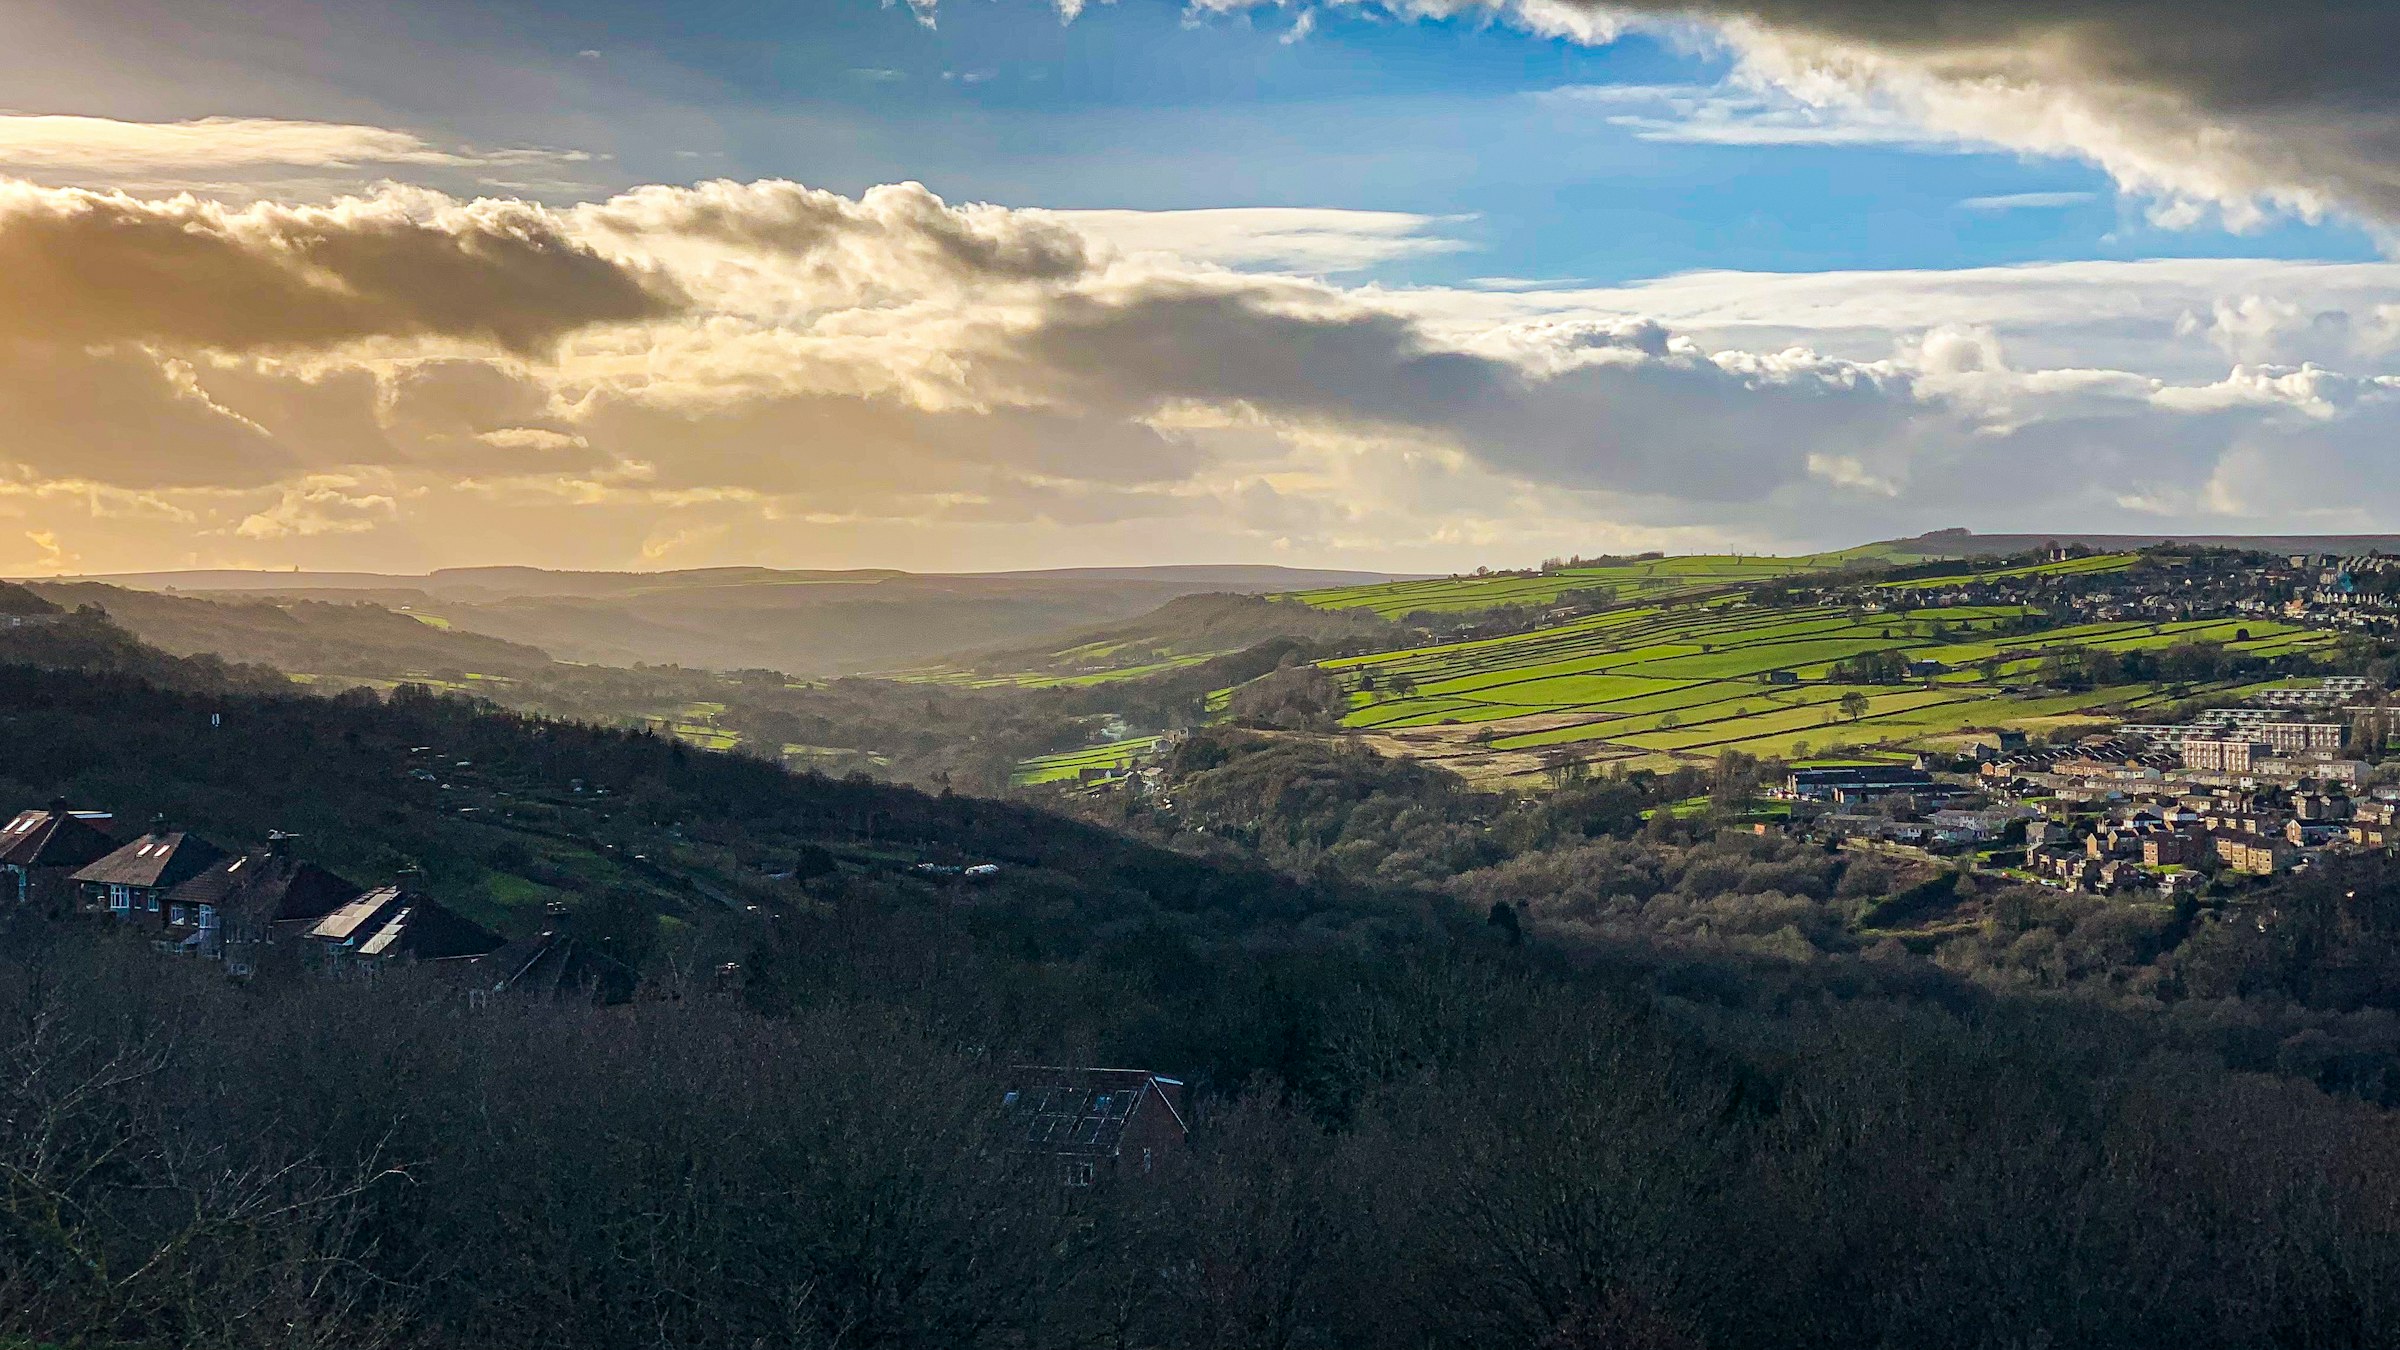
Photograph: Shane Rounce on Unsplash
All Sheffield areas · Open on the neighbourhood map
Sheffield neighbourhood
Winn Gardens, Sheffield
Inside the Winn Gardens boundary: 1 place.
Coming up in this neighbourhood
No upcoming events are located inside this boundary yet.
Businesses and places
Place
Sheffield S6 Foodbank Winn Gardens
Foodbank distribution centre serving the Winn Gardens estate (voucher needed).
Scorecard 1 card
How Winn Gardens scores
Overall 35 out of 100, ranked 129 of 147 neighbourhoods, from 5 of 7 dimensions. Each score is a percentile rank against the other neighbourhoods, not a measurement.
- 62Quiet 3 inputs
- 55Green 4 inputs
- 12Connected 5 inputs
- –Affordable not scored
- –Safe not scored
- 31Lively 4 inputs
- 14Served 7 inputs
How these scores are worked out
Each input is a percentile rank: the share of the other neighbourhoods this one is at least as good as (direction per input). A dimension is the percentile rank of the mean of its available input ranks and needs at least two inputs; the overall score is the mean of the scored dimensions. Points are placed by point-in-polygon against the Data for Action boundaries; per-head figures use Census 2021 residents for neighbourhoods with their own census areas; noise shares sample an even grid of points inside each polygon against the Defra Lden bands; distances are straight lines from the polygon centre. Winn Gardens covers 0.14 km² with 1,689 residents (Census 2021); noise was sampled at 81 points.
| Dimension | Input | Value | Rank | Better | Source | Licence |
|---|---|---|---|---|---|---|
| Quiet | Sampled points inside a Defra road-noise band (55 dB Lden and over) | 4.9% | 45 | lower | noise | Open Government Licence v3.0 |
| Quiet | Sampled points inside a Defra rail-noise band (55 dB Lden and over) | 0.0% | 100 | lower | noise | Open Government Licence v3.0 |
| Quiet | Daily vehicles at DfT count points inside the boundary (sum of AADT; 0 when no counted major road is inside) | 0 vehicles a day | 100 | lower | roads | Open Government Licence v3.0 |
| Green | Nature and green sites inside the boundary: Natural England reserves, SSSIs, ancient woodland and open access land, plus council historic parks | 0 per km² | 49 | higher | land, council_more | Open Government Licence v3.0 |
| Green | Council community-forestry trees planted inside the boundary | 0 per km² | 43 | higher | council_more | Open Government Licence v3.0 |
| Green | Recent wildlife observations inside the boundary (iNaturalist and GBIF; counts only) | 0 per km² | 75 | higher | nature | Per record: CC0, CC BY or CC BY-NC |
| Green | Playgrounds, sports pitches and dog parks on OpenStreetMap | 2.37 per 1,000 residents | 87 | higher | osm_amenities | ODbL 1.0 |
| Connected | NaPTAN bus and coach stops inside the boundary | 13.89 per km² | 33 | higher | naptan | Open Government Licence v3.0 |
| Connected | NaPTAN bus and coach stops inside the boundary | 1.18 per 1,000 residents | 1 | higher | naptan | Open Government Licence v3.0 |
| Connected | Straight-line distance from the neighbourhood centre to the nearest tram stop | 277 m | 92 | lower | naptan | Open Government Licence v3.0 |
| Connected | Straight-line distance from the neighbourhood centre to the nearest rail station entrance | 5,502 m | 8 | lower | naptan | Open Government Licence v3.0 |
| Connected | Premises able to get gigabit broadband (Ofcom Connected Nations) | 84.3% | 20 | higher | connectivity | Open Government Licence v3.0 |
| Affordable | Median sold price over the last twelve months (standard sales, at least five) | – Fewer than five sales in the window. | – | lower | pricepaid | Open Government Licence v3.0 |
| Affordable | Median sold price against the Sheffield median for the same mix of property types (1.0 = Sheffield) | – Fewer than five sales in the window. | – | lower | pricepaid | Open Government Licence v3.0 |
| Affordable | Median sold price of a terraced house (at least five sales) | – Fewer than five sales in the window. | – | lower | pricepaid | Open Government Licence v3.0 |
| Affordable | Households renting (council, other social and private), Census 2021, as a proxy for rented supply | 58.0% | 70 | higher | census_more | Open Government Licence v3.0 |
| Safe | Recorded street-level crimes over the last twelve months | – No street-level crime rows are stored. | – | lower | police | Open Government Licence v3.0 |
| Safe | Violence and sexual offences over the last twelve months | – No street-level crime rows are stored. | – | lower | police | Open Government Licence v3.0 |
| Safe | Burglaries over the last twelve months | – No street-level crime rows are stored. | – | lower | police | Open Government Licence v3.0 |
| Safe | Anti-social behaviour reports over the last twelve months | – No street-level crime rows are stored. | – | lower | police | Open Government Licence v3.0 |
| Safe | The stored police data holds neighbourhood meetings and priorities only; street-level crime counts are deliberately not stored, so no neighbourhood has a safety score yet. | |||||
| Lively | Upcoming events and classes on Sheffield Events located inside the boundary | 0 per 1,000 residents | 58 | higher | neighbourhoods | CC BY 4.0 (Sheffield Events listings inside Data for Action boundaries) |
| Lively | Businesses and places in the Sheffield Events directory located inside the boundary | 0.59 per 1,000 residents | 52 | higher | neighbourhoods | CC BY 4.0 (Sheffield Events listings inside Data for Action boundaries) |
| Lively | Real ale pubs on OpenStreetMap | 0 per 1,000 residents | 84 | higher | osm_amenities | ODbL 1.0 |
| Lively | Community centres on OpenStreetMap | 0 per 1,000 residents | 50 | higher | osm_amenities | ODbL 1.0 |
| Served | Straight-line distance from the neighbourhood centre to the nearest GP practice (NHS ODS) | 308 m | 75 | lower | nhs | Open Government Licence v3.0 |
| Served | Community pharmacies inside the boundary (NHS ODS) | 0 per 1,000 residents | 39 | higher | nhs | Open Government Licence v3.0 |
| Served | Open primary and all-through schools inside the boundary (Get Information about Schools) | 0 per 1,000 under-15s | 34 | higher | schools | Open Government Licence v3.0 |
| Served | Straight-line distance from the neighbourhood centre to the nearest library (Sheffield City Council) | 1,432 m | 25 | lower | council | Open Government Licence v3.0 |
| Served | Public defibrillators on OpenStreetMap inside the boundary | 0 per km² | 18 | higher | osm_amenities | ODbL 1.0 |
| Served | Public toilets inside the boundary (OpenStreetMap and the Toilet Map) | 0 per km² | 60 | higher | osm_amenities | ODbL 1.0 and CC BY 4.0 |
| Served | Electric vehicle chargers on OpenStreetMap inside the boundary | 0 per km² | 86 | higher | osm_amenities | ODbL 1.0 |
Areas like this
- Bradway 30
- Bradfield 29
- Sandygate 34
- Ringinglow 24
- Wharncliffe Side 31
Neighbourhood scorecards by Sheffield Events, CC BY 4.0, derived from Defra noise mapping, DfT traffic counts, Natural England, Sheffield City Council, iNaturalist and GBIF, OpenStreetMap contributors (ODbL), the Toilet Map, NaPTAN, Ofcom, HM Land Registry, ONS Census 2021, NHS ODS, Get Information about Schools and the Data for Action neighbourhood boundaries; each input keeps its own licence. CC BY 4.0 · All data sources · Download the scores (API)
Living here 5 cards
Census 2021
How people here live
Travel, homes, origins, faith, qualifications and health for the 1,692 residents of Winn Gardens, with the Sheffield figure beside each, from 1 census area.
- Most common way to work
- Driving 41.6% Sheffield Driving 45.2%
- Owner-occupied homes
- 41.8% Sheffield 58.6%
- Households without a car
- 38.4% Sheffield 29.2%
- Born outside the UK
- 24.3% Sheffield 14.9%
- Most common answer on religion
- Christian 43.7% Sheffield No religion 43.4%
- Degree-level qualified, 16 and over
- 24.1% Sheffield 33.4%
- In very good health
- 44% Sheffield 46.7%
Source: Office for National Statistics, Census 2021, via Nomis, Open Government Licence v3.0. Neighbourhood figures sum the census areas whose population-weighted centres (ONS Open Geography, contains OS data © Crown copyright and database right 2026) fall inside each boundary. Census 2021 on Nomis · All data sources
Deprivation here
1 small area (LSOA) has its population centre inside this boundary; its average IMD 2019 decile is 2.0 (1 is most deprived, 10 least).
Deprivation: English Indices of Deprivation 2019 by LSOA (MHCLG) with ONS population-weighted centroids, Open Government Licence v3.0. Decile 1 is the most deprived tenth of England. Indices of Deprivation 2019 · ONS Open Geography Portal · All data sources
Ofcom Connected Nations 2025
Broadband and mobile in Winn Gardens
498 premises in 3 census output areas whose population centres fall inside this boundary, as reported to Ofcom for July 2025.
Fixed broadband availability
- Gigabit-capable
- 84% Sheffield 93%
- 300 Mbit/s or faster
- 84% Sheffield 94%
- Superfast (30 Mbit/s or faster)
- 99% Sheffield 98%
- Cannot get 10 Mbit/s
- 0% Sheffield 0%
- Below the broadband USO
- 0% Sheffield 0%
Mobile signal
Mobile coverage is published for Sheffield as a whole: outdoor 4G from all four operators reaches 99.8% of premises, 5G from at least one operator 99.7%, and a good outdoor 4G or 5G signal from every operator 96.1%.
Availability means a service could be ordered at the address in July 2025; it is not a measured speed. Data edition: Ofcom Connected Nations 2025, published 19 November 2025.
Source: Ofcom Connected Nations 2025 data downloads (data for July 2025, published 19 November 2025), Ofcom copyright, reproduced under Ofcom's terms of use and the Open Government Licence v3.0. Output areas placed with ONS Open Geography lookups and population-weighted centroids, contains OS data © Crown copyright and database right 2026. Ofcom Connected Nations 2025 data · All data sources
Homes and prices
What sold in Winn Gardens
Only 1 standard sale was registered inside this boundary in the last twelve months, too few for a reliable local figure. Across Sheffield the median was £215,000.
Most recent registered sales
- Dec 2025 Winn Gardens Terraced £123,000
Contains HM Land Registry data © Crown copyright and database right 2026. This data is licensed under the Open Government Licence v3.0. Medians use standard sales only; the Land Registry’s additional category (for example buy-to-let and repossessions) is excluded. These are actual registered sales, not the mix-adjusted UK House Price Index estimate. Data is published one to two months in arrears and does not include every sale. Checked 25 Oct 2026. Price Paid Data · All data sources
Census 2021
Who lives in Winn Gardens
1,689 residents in 702 household, from 1 census area whose population centre falls inside this boundary.
Ages
- Under 15
- 20% Sheffield 17%
- 15 to 24
- 16% Sheffield 16%
- 25 to 44
- 26% Sheffield 26%
- 45 to 64
- 23% Sheffield 24%
- 65 and over
- 14% Sheffield 17%
Homes
- Owned
- 42% Sheffield 59%
- Social rented
- 37% Sheffield 23%
- Private rented
- 21% Sheffield 19%
- One-person households
- 37% Sheffield 33%
- Detached
- 3% Sheffield 15%
- Semi-detached
- 20% Sheffield 38%
- Terraced
- 32% Sheffield 26%
- Flats
- 45% Sheffield 21%
Work and study, residents aged 16 and over
- In work
- 55% Sheffield 53%
- Full-time students
- 10% Sheffield 14%
- Retired
- 18% Sheffield 20%
- Unemployed
- 4% Sheffield 4%
Source: Office for National Statistics licensed under the Open Government Licence v.3.0. Census 2021 tables via Nomis; population-weighted centroids from ONS Open Geography, contains OS data © Crown copyright and database right 2026. Census 2021 on Nomis · All data sources
Getting around 1 card
Department for Transport STATS19
Road collisions here, 2021 to 2025
1 road collision with someone hurt was recorded in this neighbourhood, 2021 to 2025: 0 fatal, 1 serious and 0 slight. 0 pedestrians and 0 cyclists were among the 1 people hurt.
- Collisions
- 1
- Fatal
- 0
- Serious
- 1
- Slight
- 0
- People hurt
- 1
- Pedestrians hurt
- 0
- Cyclists hurt
- 0
- 2025: 0 fatal, 1 serious, 0 slight1 hurt (pedestrians 0, cyclists 0)
Road collisions across Sheffield · On the Local Map
Road collision data from the Department for Transport (STATS19 road safety open data), Open Government Licence v3.0 Open Government Licence v3.0. Checked 12 Oct 2026. Road safety open data · All data sources
Environment and sky 6 cards
Noise here
About 3% of this area is mapped at 55 dB or more from road traffic; the loudest band here is 70 to 75 dB, covering about 1%.
Rain and rivers here
Nearest rain gauge: Ringinglow, 7.7 km away. 59.6 mm of rain in the last 7 days, wettest day Saturday 24 Oct with 27.3 mm.
Air quality here
No sensor inside this boundary; the nearest is shown.
- Within WHO guideline Sensor 100583 PM2.5 0.3, PM10 1.6 µg/m³ · 1.1 km from the centre of the area · read 29 Oct 12:54
British Geological Survey
The ground beneath Winn Gardens
At the centre of Winn Gardens the bedrock is the Pennine Lower Coal Measures Formation: mudstone, siltstone, sandstone, coal, ironstone and ferricrete, Carboniferous, Langsettian (Westphalian A), about 316 to 314 million years ago, on the BGS 1:625 000 bedrock map (unit PSLCM). The 1:625 000 map is a regional overview generalised from more detailed sheets: it describes the ground under a neighbourhood as a whole and is not a site investigation.
Contains British Geological Survey materials © UKRI 2026. Open Government Licence v3.0. Checked 10 Oct 2026. BGS Geology 625k bedrock · All data sources
Recorded flood outlines
Floods recorded here
The Environment Agency has mapped 3 floods reaching part of Winn Gardens, the earliest in 2007. The outlines show where water got to those times, not where it will go next, and floods that nobody surveyed are not recorded.
- 2022 February Flood Incident – Storm Dudley, Eunice and Franklin20 Feb to 28 Mar 2022 · 1 outline · main river · channel capacity exceeded
- 2019 November Flood Incident7 to 8 Nov 2019 · 1 outline · main river · channel capacity exceeded
- 2007 River Don Oughtibridge to Wadsley Bridge15 to 30 Jun 2007 · 1 outline · main river · channel capacity exceeded
The outlines on the Local Map · Today's river levels
Recorded Flood Outlines, © Environment Agency copyright and/or database right 2025. Open Government Licence v3.0. Checked 12 Oct 2026. Recorded Flood Outlines dataset · All data sources
Ordnance Survey, OS Open Greenspace
Pitches, courts and greens here
- Bowling greens
- 1
- Play spaces
- 1
- Gates and entrances
- 5
Across Sheffield · On the Local Map
Contains OS data © Crown copyright and database right 2026. OS Open Greenspace, Open Government Licence v3.0. Checked 12 Oct 2026. Dataset: OS Open Greenspace, 2026-04 release · All data sources
Council and democracy 2 cards
Council data for this area
What Sheffield City Council's open data records inside this boundary.
- 20 mph zone Winn Gardens C01
- Polling station Middlewood Pavilion 109 Winn Grove Sheffield S6 1UN Hillsborough Ward · district QK & XI
- Litter bins 7 council litter bins on the streets here
Valuation Office Agency
Council tax bands here
The 1 small area (LSOA) whose population centre falls in this neighbourhood holds about 740 homes on the council tax list; 76% are in Band A, against 58% across Sheffield. The average full bill across these homes before discounts is about £1,745 a year in 2026-27, worked out from the Band D figure. A few very small counts are withheld by the VOA, so the bands add up to slightly fewer homes than the total.
| Area | Band A | Band B | Band C | Bands D to H |
|---|---|---|---|---|
| Winn Gardens | 75.7% | 23% | 1.4% | 0% |
| Sheffield | 58% | 16.3% | 12.7% | 13% |
- Homes
- 740
- Band A
- 76%
- Band B
- 23%
- Band C
- 1%
- Bands D to H
- 0%
- Band A: 560 homes (75.7%)Valued up to £40,000 in 1991 · £1,673.44 full bill, 2026-27
- Band B: 170 homes (23.0%)Valued £40,001 to £52,000 in 1991 · £1,952.35 full bill, 2026-27
- Band C: 10 homes (1.4%)Valued £52,001 to £68,000 in 1991 · £2,231.25 full bill, 2026-27
- Band D: 0 homes (0.0%)Valued £68,001 to £88,000 in 1991 · £2,510.16 full bill, 2026-27
- Band E: 0 homes (0.0%)Valued £88,001 to £120,000 in 1991 · £3,067.97 full bill, 2026-27
- Band F: 0 homes (0.0%)Valued £120,001 to £160,000 in 1991 · £3,625.79 full bill, 2026-27
- Band G: 0 homes (0.0%)Valued £160,001 to £320,000 in 1991 · £4,183.60 full bill, 2026-27
- Band H: 0 homes (0.0%)Valued over £320,000 in 1991 · £5,020.32 full bill, 2026-27
Council tax bands across Sheffield · On the Local Map
Council tax stock of properties (table CTSOP1.1) from the Valuation Office Agency, Open Government Licence v3.0 Open Government Licence v3.0. Checked 12 Oct 2026. Valuation Office council tax statistics · Background notes · All data sources
Money and energy 3 cards
National Lottery grant database
Lottery money in Hillsborough ward
Awards filed to recipients in Hillsborough ward, the ward this area sits in. Awards to individuals are counted in the figures and never named.
- Awards since 1995
- 215
- Awarded in total
- £9.0m
- Awards since 2022
- 45
- Awarded since 2022
- £1.7m
Latest awards to organisations here
- RivelinCo Creative · £20,000Community Hub on Hillsborough High Street · National Lottery Awards for All England · The National Lottery Community Fund · 2 Jul 2026
- Under the Stars · £30,000Sistarz – Our Lives, Our Struggle, Our Story · National Lottery Project Grants · Arts Council England · 10 Jun 2026
- Sheffield Wednesday Football Club Community Programme · £14,300Stronger for Longer · Sport England · 6 May 2026
Lottery money across Sheffield
National Lottery grant data from the Department for Culture, Media and Sport, Open Government Licence v3.0. Checked 28 Oct 2026. National Lottery grant database · Sheffield export (CSV) · All data sources
Office for National Statistics via Nomis
Work in this area
Winn Gardens sits in Hillsborough ward. The claimant count is the number of people there on Universal Credit or Jobseeker's Allowance who are required to look for work, as a share of residents aged 16 to 64; the ward series begins in January 2026.
- Claimants in Hillsborough ward
- 460Sep 2026
- Share of residents aged 16 to 64
- 3.6%Sep 2026
- Sheffield
- 4.4%16,785 claimants, Sep 2026
| Month | Hillsborough | Sheffield |
|---|---|---|
| Jan 2026 | 3.4 % | 4.2 % |
| Feb 2026 | 3.5 % | 4.3 % |
| Mar 2026 | 3.5 % | 4.3 % |
| Apr 2026 | 3.5 % | 4.3 % |
| May 2026 | 3.6 % | 4.3 % |
| Jun 2026 | 3.5 % | 4.3 % |
| Jul 2026 | 3.5 % | 4.3 % |
| Aug 2026 | 3.6 % | 4.3 % |
| Sep 2026 | 3.6 % | 4.4 % |
Source: Office for National Statistics licensed under the Open Government Licence v3.0, via Nomis. Ward boundaries from ONS Open Geography, OGL v3.0. Checked 26 Oct 2026. Claimant count on Nomis · Nomis · All data sources
Sheffield City Council business rates
Rated business premises here
2 premises in Winn Gardens are on the business rates list, with a combined rateable value of £21,700.
- Rated premises
- 2
- Total rateable value
- £21,700
- Middle rateable value
- £10,850
- Shops and retail
- 0
- Offices
- 1
- Workshops, warehouses and industry
- 0
- Pubs, restaurants, cafes and hotels
- 0
Commonest kinds
- Offices And Premises1 premises
- Community Centre And Premises1 premises
Streets with the most premises
- Winn Drive, S61 rated premises
- Winn Grove, S61 rated premises
Highest rateable values here
- The Pavilion, 109 Winn Grove, S6 1UNCommunity Centre And Premises · rateable value £18,750 · rates paid by Sheffield City Council
- 126 Winn Drive, S6 1UDOffices And Premises · rateable value £2,950 · rates paid by Winn Gardens Tenants & Residents Association
Business premises across Sheffield · On the Local Map
Business rates public dataset from Sheffield City Council via Data Mill North, Open Government Licence v3. Checked 12 Oct 2026. Business rates on Data Mill North · All data sources
Sport and facilities 1 card
Somewhere to play here
1 site inside this boundary, with 3 facilities on it.
- Middlewood Park 3 × Grass Pitches · Local Authority
Community 1 card
Around here
6 everyday places mapped inside this boundary by OpenStreetMap volunteers and the Toilet Map.
- Nearest defibrillator Defibrillator 350 m away from the centre of the area
- Nearest toilets Toilets 650 m away from the centre of the area
- Nearest cycle parking Cycle parking 300 m away from the centre of the area
- Nearest ev charger EV charger 560 m away from the centre of the area
Charts 1 card
In numbers
Winn Gardens in numbers
The same census and Land Registry figures shown above, drawn so the shape is easier to see, and set against every other Sheffield neighbourhood. Hover or tab to a bar for its value; every chart has its data as a table.
Ages
Homes
| Area | Owned | Social rented | Private rented |
|---|---|---|---|
| Winn Gardens | 41.8% | 37.3% | 20.9% |
| Sheffield | 58.6% | 22.6% | 18.8% |
| Area | Detached | Semi-detached | Terraced | Flats |
|---|---|---|---|---|
| Winn Gardens | 2.8% | 20.3% | 32.2% | 44.6% |
| Sheffield | 15% | 38% | 26% | 21% |
Sold prices by month
Only 1 sale was registered inside Winn Gardens in the last twelve months; the monthly chart needs at least 12.
How this neighbourhood compares
Each measure is compared across the 126 Sheffield neighbourhoods that have their own census area; r is the correlation from -1 to 1. A pattern across neighbourhoods is not a cause, and it says nothing about any one street or household.
Full-time students and private renting
Winn Gardens ranks 36th of 126 for full-time students (9.8%) and 38th of 126 for private renting (20.9%). Across 126 neighbourhoods there is a strong link between full-time students and private renting (r = 0.85): the two rise together. Student areas are let by the room and by the year, so a high student share usually means a high private-renting share.
| Neighbourhood | Full-time students | Private renting |
|---|---|---|
| Stocksbridge | 4.8% | 13% |
| Deepcar | 5.2% | 10.8% |
| High Green | 5.2% | 10.1% |
| Burncross | 3.3% | 7.6% |
| Chapeltown | 4.5% | 10.9% |
| Grenoside | 3.7% | 7.9% |
| Ecclesfield | 4.7% | 14.2% |
| Colley | 6.5% | 8.4% |
| Shiregreen | 7.2% | 12.1% |
| Worral | 5.3% | 4.9% |
| Wharncliffe Side | 7.8% | 8.9% |
| Oughtibridge | 5.3% | 9.8% |
| Middlewood | 6.2% | 14.7% |
| Foxhill | 5.6% | 13.4% |
| Parson Cross | 7.1% | 9.3% |
| Firth Park | 11.1% | 19.2% |
| Sheffield Lane Top | 9% | 11.1% |
| Birley Carr | 5.3% | 15.4% |
| Southey | 7.9% | 11.3% |
| Wadsley Bridge | 4.1% | 18.3% |
| Longley | 8.3% | 11.7% |
| Wincobank | 6.3% | 17.3% |
| Brightside | 9.7% | 15.7% |
| Grimesthorpe | 7.5% | 32.4% |
| Wadsley | 6% | 10.8% |
| Hillsborough | 5.7% | 25.6% |
| Winn Gardens | 9.8% | 20.9% |
| Owlerton | 6.1% | 36.3% |
| Tinsley | 11.2% | 29.9% |
| Darnall | 12.1% | 20.2% |
| Pitsmoor | 11.6% | 29.6% |
| Firshill | 10.6% | 10.5% |
| Shirecliffe | 7.3% | 11.9% |
| Osgathorpe | 11.5% | 18.4% |
| Fir Vale | 14.1% | 35.7% |
| Wisewood | 5.6% | 8.4% |
| Malin Bridge | 6% | 20.8% |
| Burngreave | 14.4% | 18.6% |
| Page Hall | 11.6% | 38% |
| Wicker | 14.4% | 57.5% |
| Stannington West | 5.2% | 6.7% |
| Loxley | 4.8% | 6.7% |
| Stannington East and Deer Park | 5% | 6.2% |
| Walkley | 8.9% | 26.8% |
| Crookes | 24.3% | 34.6% |
| Rivelin | 5.9% | 8.8% |
| Upperthorpe | 16.2% | 30% |
| Netherthorpe | 64.3% | 53.6% |
| Crookesmoor | 57.3% | 51.4% |
| Tapton | 10.8% | 21.7% |
| Broomhill | 50.1% | 51.1% |
| Handsworth | 5.5% | 12.8% |
| Littledale | 9.2% | 17.7% |
| Crosspool | 6.5% | 8.8% |
| Sandygate | 5.4% | 10.9% |
| Endcliffe | 64.5% | 30.2% |
| Hunters Bar | 35.7% | 48.2% |
| Broomhall | 57.9% | 48.4% |
| Ranmoor | 7.5% | 25.3% |
| Nether Green | 7.2% | 21.6% |
| Woodthorpe | 8.9% | 15.3% |
| Manor | 7.5% | 16.6% |
| Sharrow | 44.1% | 50.1% |
| Sharrow Vale | 36% | 56.3% |
| Little Sheffield | 47.1% | 35.9% |
| Lodge Moor | 7.4% | 7.4% |
| Fulwood | 6.2% | 8.5% |
| Lowfield | 24.7% | 54.6% |
| Highfield | 61.8% | 54% |
| Nether Edge | 11.2% | 30.6% |
| Cultural Industries Quarter | 79.3% | 82.1% |
| Norfolk Park | 13.1% | 28.1% |
| Arbourthorne | 7.6% | 10.7% |
| Heeley | 7.4% | 17.3% |
| Woodhouse | 5.4% | 10.6% |
| Richmond | 5.6% | 9.8% |
| Intake | 4.8% | 13.8% |
| Carterknowle | 7.6% | 18.6% |
| Ecclesall | 6.2% | 4.2% |
| Greystones | 8.6% | 14.6% |
| Banner Cross | 11.7% | 31.6% |
| High Storrs | 5.6% | 3.9% |
| Hurlfield | 6.1% | 8.9% |
| Newfield Green | 8.8% | 8.1% |
| Gleadless Townend | 4.1% | 12.9% |
| Meersbrook | 6.4% | 26% |
| Gleadless | 6.3% | 11.2% |
| Parkhead | 6.7% | 5.4% |
| Millhouses | 6.5% | 7.6% |
| Bents Green | 6.2% | 8.3% |
| Beighton | 4.5% | 13.7% |
| Hackenthorpe | 4% | 9.8% |
| Woodseats | 5.5% | 23.7% |
| Herdings | 5.7% | 10.8% |
| Hemsworth | 7.6% | 12.4% |
| Owlthorpe | 5.6% | 7.8% |
| Charnock | 5.2% | 9.9% |
| Base Green | 6.9% | 12.7% |
| Sothall | 4.6% | 10.2% |
| Norton Lees | 4% | 8.2% |
| Meadowhead | 5.6% | 5.6% |
| Norton | 6.6% | 12.8% |
| Westfield | 5.9% | 9.3% |
| Waterthorpe | 3.1% | 10.1% |
| Halfway | 5% | 12.1% |
| Greenhill | 5.1% | 7.4% |
| Beauchief | 5.2% | 7% |
| Dore | 5.1% | 8.3% |
| Totley | 6% | 10.2% |
| Whirlow | 6.8% | 4.8% |
| Lowedges | 7.9% | 14% |
| Jordanthorpe | 7.3% | 9.8% |
| Batemoor | 8.4% | 11.9% |
| Bradway | 6.4% | 6.1% |
| Mosborough | 6.2% | 11.3% |
| Saint Vincent's and Shalesmoor | 64.5% | 69.4% |
| Neepsend | 29.3% | 64.7% |
| Cathedral Quarter | 44.6% | 73.4% |
| City Centre | 55% | 69.5% |
| Devonshire Quarter | 67.3% | 72.6% |
| Wybourn | 7% | 10.2% |
| Park Hill | 29.3% | 33.8% |
| Hyde Park | 12.1% | 9.8% |
| Frecheville | 4% | 10.5% |
| Birley | 5% | 12.8% |
| Birley Spa | 5.4% | 10% |
Median sold price and owner occupation
Winn Gardens is not on this chart because it has too few sales for a reliable median. Across 120 neighbourhoods there is a moderate link between median sold price and owner occupation (r = 0.67): the two rise together. Where more homes are owned outright or with a mortgage, sold prices tend to be higher; renting-heavy areas cluster lower.
| Neighbourhood | Median sold price | Owner occupation |
|---|---|---|
| Stocksbridge | £183k | 71.5% |
| Deepcar | £189k | 79.5% |
| High Green | £203k | 71.7% |
| Burncross | £270k | 90.6% |
| Chapeltown | £217k | 78.7% |
| Grenoside | £288k | 86.3% |
| Ecclesfield | £200k | 66.9% |
| Colley | £208k | 60.3% |
| Shiregreen | £145k | 41% |
| Worral | £463k | 90.1% |
| Wharncliffe Side | £260k | 69.2% |
| Oughtibridge | £265k | 79.1% |
| Middlewood | £208k | 71.5% |
| Foxhill | £169k | 54.7% |
| Parson Cross | £177k | 40% |
| Firth Park | £160k | 41.6% |
| Sheffield Lane Top | £165k | 42.3% |
| Birley Carr | £155k | 80.5% |
| Southey | £136k | 37.9% |
| Wadsley Bridge | £171k | 47.9% |
| Longley | £137k | 34.1% |
| Wincobank | £155k | 67.5% |
| Grimesthorpe | £132k | 54.3% |
| Wadsley | £245k | 69.3% |
| Hillsborough | £220k | 60.6% |
| Owlerton | £150k | 55% |
| Tinsley | £84k | 55.4% |
| Darnall | £147k | 47.3% |
| Pitsmoor | £144k | 49.4% |
| Firshill | £90k | 40.9% |
| Shirecliffe | £155k | 35.6% |
| Osgathorpe | £73k | 41.7% |
| Fir Vale | £111k | 51.7% |
| Wisewood | £244k | 65.3% |
| Malin Bridge | £213k | 72.2% |
| Page Hall | £79k | 42.5% |
| Wicker | £84k | 16.4% |
| Stannington West | £300k | 82.9% |
| Loxley | £380k | 79.8% |
| Stannington East and Deer Park | £265k | 65.7% |
| Walkley | £240k | 65.7% |
| Crookes | £267k | 57.4% |
| Rivelin | £263k | 77.5% |
| Upperthorpe | £240k | 17.8% |
| Netherthorpe | £108k | 8.7% |
| Crookesmoor | £221k | 32.4% |
| Tapton | £209k | 71.6% |
| Broomhill | £280k | 41.4% |
| Handsworth | £208k | 73.6% |
| Littledale | £148k | 56.4% |
| Crosspool | £370k | 89.5% |
| Sandygate | £373k | 70.7% |
| Endcliffe | £306k | 65.3% |
| Hunters Bar | £335k | 48.3% |
| Broomhall | £171k | 20.9% |
| Ranmoor | £514k | 69.1% |
| Nether Green | £339k | 72% |
| Woodthorpe | £163k | 35.3% |
| Manor | £166k | 39.3% |
| Sharrow | £210k | 24% |
| Sharrow Vale | £325k | 39.8% |
| Lodge Moor | £450k | 90% |
| Fulwood | £545k | 90.3% |
| Lowfield | £118k | 34.7% |
| Highfield | £170k | 23.5% |
| Nether Edge | £253k | 62.3% |
| Cultural Industries Quarter | £109k | 9.7% |
| Norfolk Park | £222k | 43.8% |
| Arbourthorne | £133k | 33% |
| Heeley | £200k | 52.4% |
| Woodhouse | £190k | 54.8% |
| Richmond | £163k | 49.4% |
| Intake | £175k | 68.6% |
| Carterknowle | £335k | 78.6% |
| Ecclesall | £315k | 94.3% |
| Greystones | £329k | 82.3% |
| Banner Cross | £296k | 67.1% |
| High Storrs | £423k | 95.6% |
| Hurlfield | £175k | 59.6% |
| Newfield Green | £133k | 26.5% |
| Gleadless Townend | £183k | 79.6% |
| Meersbrook | £250k | 70.5% |
| Gleadless | £150k | 65% |
| Parkhead | £610k | 93.5% |
| Millhouses | £385k | 89.7% |
| Bents Green | £453k | 86.8% |
| Beighton | £195k | 66.1% |
| Hackenthorpe | £190k | 72.3% |
| Woodseats | £228k | 70.5% |
| Herdings | £130k | 38% |
| Hemsworth | £136k | 40.8% |
| Owlthorpe | £300k | 75.7% |
| Charnock | £223k | 81.3% |
| Base Green | £186k | 47.7% |
| Sothall | £230k | 89.3% |
| Norton Lees | £258k | 83.1% |
| Meadowhead | £345k | 81.2% |
| Norton | £400k | 71.9% |
| Westfield | £150k | 44.7% |
| Waterthorpe | £168k | 73.2% |
| Halfway | £236k | 76.3% |
| Greenhill | £324k | 80.8% |
| Beauchief | £424k | 81.5% |
| Dore | £575k | 86.7% |
| Totley | £440k | 77.3% |
| Whirlow | £658k | 92.9% |
| Lowedges | £150k | 31% |
| Jordanthorpe | £150k | 35.4% |
| Bradway | £425k | 87.6% |
| Mosborough | £248k | 79% |
| Saint Vincent's and Shalesmoor | £90k | 19.1% |
| Neepsend | £164k | 17.3% |
| Cathedral Quarter | £107k | 20.1% |
| City Centre | £130k | 13% |
| Devonshire Quarter | £111k | 13% |
| Wybourn | £163k | 30.9% |
| Park Hill | £219k | 32.4% |
| Frecheville | £183k | 84.2% |
| Birley | £183k | 65.5% |
| Birley Spa | £165k | 44.9% |
Median sold price and detached homes
Winn Gardens is not on this chart because it has too few sales for a reliable median. Across 120 neighbourhoods there is a moderate link between median sold price and detached homes (r = 0.69): the two rise together. Home type drives price: a neighbourhood of detached houses sells for more than one of terraces and flats, whatever else is true of it.
| Neighbourhood | Median sold price | Detached homes |
|---|---|---|
| Stocksbridge | £183k | 21.7% |
| Deepcar | £189k | 39.8% |
| High Green | £203k | 30.4% |
| Burncross | £270k | 24.9% |
| Chapeltown | £217k | 24.1% |
| Grenoside | £288k | 32.3% |
| Ecclesfield | £200k | 21.2% |
| Colley | £208k | 7.9% |
| Shiregreen | £145k | 3.1% |
| Worral | £463k | 54.8% |
| Wharncliffe Side | £260k | 25.8% |
| Oughtibridge | £265k | 29% |
| Middlewood | £208k | 38.7% |
| Foxhill | £169k | 5.7% |
| Parson Cross | £177k | 4.3% |
| Firth Park | £160k | 6.6% |
| Sheffield Lane Top | £165k | 3.9% |
| Birley Carr | £155k | 11.4% |
| Southey | £136k | 4.5% |
| Wadsley Bridge | £171k | 6.8% |
| Longley | £137k | 5.3% |
| Wincobank | £155k | 6% |
| Grimesthorpe | £132k | 7.3% |
| Wadsley | £245k | 12.8% |
| Hillsborough | £220k | 3.8% |
| Owlerton | £150k | 2.2% |
| Tinsley | £84k | 9.2% |
| Darnall | £147k | 7.3% |
| Pitsmoor | £144k | 8.3% |
| Firshill | £90k | 17.3% |
| Shirecliffe | £155k | 6% |
| Osgathorpe | £73k | 7.6% |
| Fir Vale | £111k | 11% |
| Wisewood | £244k | 9.2% |
| Malin Bridge | £213k | 10.2% |
| Page Hall | £79k | 11.3% |
| Wicker | £84k | 0.8% |
| Stannington West | £300k | 40.9% |
| Loxley | £380k | 35.2% |
| Stannington East and Deer Park | £265k | 20.3% |
| Walkley | £240k | 11.6% |
| Crookes | £267k | 4.7% |
| Rivelin | £263k | 14.7% |
| Upperthorpe | £240k | 2.3% |
| Netherthorpe | £108k | 0.9% |
| Crookesmoor | £221k | 7.6% |
| Tapton | £209k | 7.8% |
| Broomhill | £280k | 10.2% |
| Handsworth | £208k | 9.7% |
| Littledale | £148k | 4.3% |
| Crosspool | £370k | 24.1% |
| Sandygate | £373k | 41.5% |
| Endcliffe | £306k | 15.3% |
| Hunters Bar | £335k | 9% |
| Broomhall | £171k | 4.6% |
| Ranmoor | £514k | 16.8% |
| Nether Green | £339k | 17.6% |
| Woodthorpe | £163k | 6.1% |
| Manor | £166k | 4.4% |
| Sharrow | £210k | 3.4% |
| Sharrow Vale | £325k | 6.5% |
| Lodge Moor | £450k | 44.7% |
| Fulwood | £545k | 41.1% |
| Lowfield | £118k | 4.2% |
| Highfield | £170k | 4.2% |
| Nether Edge | £253k | 14.4% |
| Cultural Industries Quarter | £109k | 0.2% |
| Norfolk Park | £222k | 4.7% |
| Arbourthorne | £133k | 4.8% |
| Heeley | £200k | 4% |
| Woodhouse | £190k | 15.4% |
| Richmond | £163k | 3.8% |
| Intake | £175k | 13.4% |
| Carterknowle | £335k | 15.7% |
| Ecclesall | £315k | 35% |
| Greystones | £329k | 6.5% |
| Banner Cross | £296k | 3.7% |
| High Storrs | £423k | 9.2% |
| Hurlfield | £175k | 4.1% |
| Newfield Green | £133k | 3.5% |
| Gleadless Townend | £183k | 12.9% |
| Meersbrook | £250k | 6.7% |
| Gleadless | £150k | 22.8% |
| Parkhead | £610k | 59.4% |
| Millhouses | £385k | 29% |
| Bents Green | £453k | 30.2% |
| Beighton | £195k | 22.6% |
| Hackenthorpe | £190k | 36.1% |
| Woodseats | £228k | 7.6% |
| Herdings | £130k | 3.1% |
| Hemsworth | £136k | 3.7% |
| Owlthorpe | £300k | 52.6% |
| Charnock | £223k | 7.8% |
| Base Green | £186k | 3.7% |
| Sothall | £230k | 61.7% |
| Norton Lees | £258k | 17.8% |
| Meadowhead | £345k | 18.5% |
| Norton | £400k | 36.2% |
| Westfield | £150k | 9.7% |
| Waterthorpe | £168k | 32.2% |
| Halfway | £236k | 39.7% |
| Greenhill | £324k | 23.4% |
| Beauchief | £424k | 30% |
| Dore | £575k | 61.7% |
| Totley | £440k | 27.7% |
| Whirlow | £658k | 63.4% |
| Lowedges | £150k | 1.5% |
| Jordanthorpe | £150k | 3.2% |
| Bradway | £425k | 41.9% |
| Mosborough | £248k | 41.2% |
| Saint Vincent's and Shalesmoor | £90k | 0.3% |
| Neepsend | £164k | 0.9% |
| Cathedral Quarter | £107k | 0.6% |
| City Centre | £130k | 0.2% |
| Devonshire Quarter | £111k | 1.1% |
| Wybourn | £163k | 5.3% |
| Park Hill | £219k | 3.2% |
| Frecheville | £183k | 4.4% |
| Birley | £183k | 5% |
| Birley Spa | £165k | 3.5% |
Aged 65 and over and one-person households
Winn Gardens ranks 78th of 126 for aged 65 and over (14.4%) and 27th of 126 for one-person households (36.8%). Across 126 neighbourhoods there is a moderate link between aged 65 and over and one-person households (r = -0.52): the two move in opposite directions. Older residents are more likely to live alone, so the two shares tend to rise together; student areas are the usual exception.
| Neighbourhood | Aged 65 and over | One-person households |
|---|---|---|
| Stocksbridge | 24.7% | 30.9% |
| Deepcar | 23.5% | 29.6% |
| High Green | 21.7% | 28.9% |
| Burncross | 32.8% | 26% |
| Chapeltown | 28.3% | 28.1% |
| Grenoside | 30.1% | 28.6% |
| Ecclesfield | 26.2% | 38.1% |
| Colley | 17.1% | 29.7% |
| Shiregreen | 12.8% | 27.5% |
| Worral | 27.2% | 21% |
| Wharncliffe Side | 21.6% | 26.1% |
| Oughtibridge | 18.6% | 28.2% |
| Middlewood | 13.5% | 30.7% |
| Foxhill | 17.2% | 31.6% |
| Parson Cross | 14% | 29.5% |
| Firth Park | 13.9% | 31.8% |
| Sheffield Lane Top | 12.9% | 29.9% |
| Birley Carr | 23.6% | 35.2% |
| Southey | 12.6% | 30.3% |
| Wadsley Bridge | 17.8% | 40% |
| Longley | 17.4% | 35.8% |
| Wincobank | 20.6% | 34.1% |
| Brightside | 10.4% | 32.4% |
| Grimesthorpe | 11.7% | 33.5% |
| Wadsley | 20.4% | 27.8% |
| Hillsborough | 17.5% | 37.6% |
| Winn Gardens | 14.4% | 36.8% |
| Owlerton | 18.7% | 48.7% |
| Tinsley | 11.5% | 24.3% |
| Darnall | 10.9% | 27.9% |
| Pitsmoor | 13.1% | 35.7% |
| Firshill | 13.8% | 45.7% |
| Shirecliffe | 15.2% | 34.8% |
| Osgathorpe | 10.6% | 30.6% |
| Fir Vale | 8.2% | 23.8% |
| Wisewood | 20.9% | 31.2% |
| Malin Bridge | 17.3% | 30.9% |
| Burngreave | 8.9% | 34% |
| Page Hall | 8.1% | 25.5% |
| Wicker | 3% | 50.9% |
| Stannington West | 26.8% | 28.1% |
| Loxley | 28.5% | 26.9% |
| Stannington East and Deer Park | 24.3% | 35% |
| Walkley | 14.4% | 35.6% |
| Crookes | 12.7% | 31.2% |
| Rivelin | 21.2% | 33.5% |
| Upperthorpe | 12.6% | 47.5% |
| Netherthorpe | 2.8% | 53.6% |
| Crookesmoor | 7.8% | 32.6% |
| Tapton | 18.6% | 30.4% |
| Broomhill | 11.7% | 36.5% |
| Handsworth | 20.7% | 29.8% |
| Littledale | 18.3% | 32.7% |
| Crosspool | 21.7% | 21.2% |
| Sandygate | 29.6% | 39.5% |
| Endcliffe | 9.6% | 36.5% |
| Hunters Bar | 8% | 22.4% |
| Broomhall | 6.7% | 40% |
| Ranmoor | 20.7% | 41.6% |
| Nether Green | 19.3% | 30.2% |
| Woodthorpe | 12.3% | 31.4% |
| Manor | 12.5% | 36.9% |
| Sharrow | 5.6% | 45.1% |
| Sharrow Vale | 9.8% | 33.2% |
| Little Sheffield | 4.2% | 48.7% |
| Lodge Moor | 24.7% | 22.1% |
| Fulwood | 28% | 24.3% |
| Lowfield | 5.6% | 31% |
| Highfield | 5% | 35.3% |
| Nether Edge | 14.9% | 35.9% |
| Cultural Industries Quarter | 0.5% | 54.5% |
| Norfolk Park | 11.6% | 33.4% |
| Arbourthorne | 13.8% | 34.6% |
| Heeley | 16.1% | 36.6% |
| Woodhouse | 20.8% | 36.8% |
| Richmond | 17.1% | 32% |
| Intake | 24.8% | 33.8% |
| Carterknowle | 15.7% | 27.3% |
| Ecclesall | 26.2% | 22% |
| Greystones | 15.7% | 24.4% |
| Banner Cross | 7% | 23.7% |
| High Storrs | 21.2% | 20.3% |
| Hurlfield | 19.6% | 29% |
| Newfield Green | 15.9% | 41.1% |
| Gleadless Townend | 28.2% | 33.4% |
| Meersbrook | 12.4% | 32.5% |
| Gleadless | 20.2% | 30.4% |
| Parkhead | 29.7% | 21.9% |
| Millhouses | 23.2% | 25.1% |
| Bents Green | 24.9% | 25.4% |
| Beighton | 17.6% | 28.7% |
| Hackenthorpe | 27.9% | 31.8% |
| Woodseats | 15.6% | 33.3% |
| Herdings | 18.8% | 45.9% |
| Hemsworth | 15.2% | 35.5% |
| Owlthorpe | 18.4% | 26.3% |
| Charnock | 25.1% | 32.1% |
| Base Green | 17.7% | 34.4% |
| Sothall | 18.4% | 22.4% |
| Norton Lees | 23.5% | 28.5% |
| Meadowhead | 29.1% | 28.5% |
| Norton | 30.4% | 35.9% |
| Westfield | 17.2% | 35.2% |
| Waterthorpe | 34.9% | 36.5% |
| Halfway | 21.3% | 30.6% |
| Greenhill | 23.3% | 30.7% |
| Beauchief | 29.8% | 30.7% |
| Dore | 31% | 27.8% |
| Totley | 23% | 33.7% |
| Whirlow | 28.1% | 18.9% |
| Lowedges | 12% | 39.7% |
| Jordanthorpe | 17.7% | 45.8% |
| Batemoor | 11.9% | 40.6% |
| Bradway | 28.1% | 27.6% |
| Mosborough | 19.5% | 25.2% |
| Saint Vincent's and Shalesmoor | 1.2% | 52.7% |
| Neepsend | 2.3% | 50.1% |
| Cathedral Quarter | 1.3% | 53.1% |
| City Centre | 2.2% | 58.7% |
| Devonshire Quarter | 1.9% | 51.5% |
| Wybourn | 13.4% | 28.1% |
| Park Hill | 11.9% | 45.5% |
| Hyde Park | 6.4% | 33.6% |
| Frecheville | 18.9% | 24.8% |
| Birley | 19% | 29.8% |
| Birley Spa | 17.9% | 34.4% |
Source: Office for National Statistics licensed under the Open Government Licence v.3.0. Census 2021 tables via Nomis; population-weighted centroids from ONS Open Geography, contains OS data © Crown copyright and database right 2026. Contains HM Land Registry data © Crown copyright and database right 2026. This data is licensed under the Open Government Licence v3.0. All data sources
More 2 cards
Recorded crime here, August 2026
8 offences were recorded inside this boundary in August 2026.
| Offence type | Recorded |
|---|---|
| Violence and sexual offences | 5 |
| Anti-social behaviour | 2 |
| Public order | 1 |
Offences recorded by South Yorkshire Police in August 2026, counted into this neighbourhood. Locations published by the Home Office are approximate by design, so this is a count for the area, never for a street or an address.
Alerts
Follow Winn Gardens and hear what happens here: new events and places listed, planning applications, roadworks, storm overflows, floods and poor air. Floods and overflows arrive straight away; the rest come as one round-up at 8am, grouped by area.
Yorkshire Water (CC BY 4.0), Environment Agency (OGL v3), UK PlanIt and TomTom via the live map.
Winn Gardens: your questions answered
Which venues and businesses are in Winn Gardens?
1 directory entries sit inside Winn Gardens, including Sheffield S6 Foodbank Winn Gardens. Each has its address, opening details where published and its upcoming events.
Which areas are next to Winn Gardens?
The areas nearest to Winn Gardens are Wadsley Bridge, Birley Carr, Wadsley, Middlewood, Foxhill. Each has its own page with the events and places inside it.
How is the Winn Gardens boundary defined?
The boundary is the Winn Gardens polygon from the Sheffield neighbourhoods dataset published by Data for Action, one of 147 across the city. Events, businesses, places and charities are placed inside it by their coordinates, so a venue just over the line appears on the neighbouring page instead.
Neighbouring areas
Neighbourhood boundaries by Data for Action, licensed CC BY 4.0 and used with credit. Snapshot 946d748, published 16 Dec 2025, last checked 13 Oct 2026. Records are placed by their stored coordinates; a point on a shared boundary belongs to the first neighbourhood in the source file. All data sources