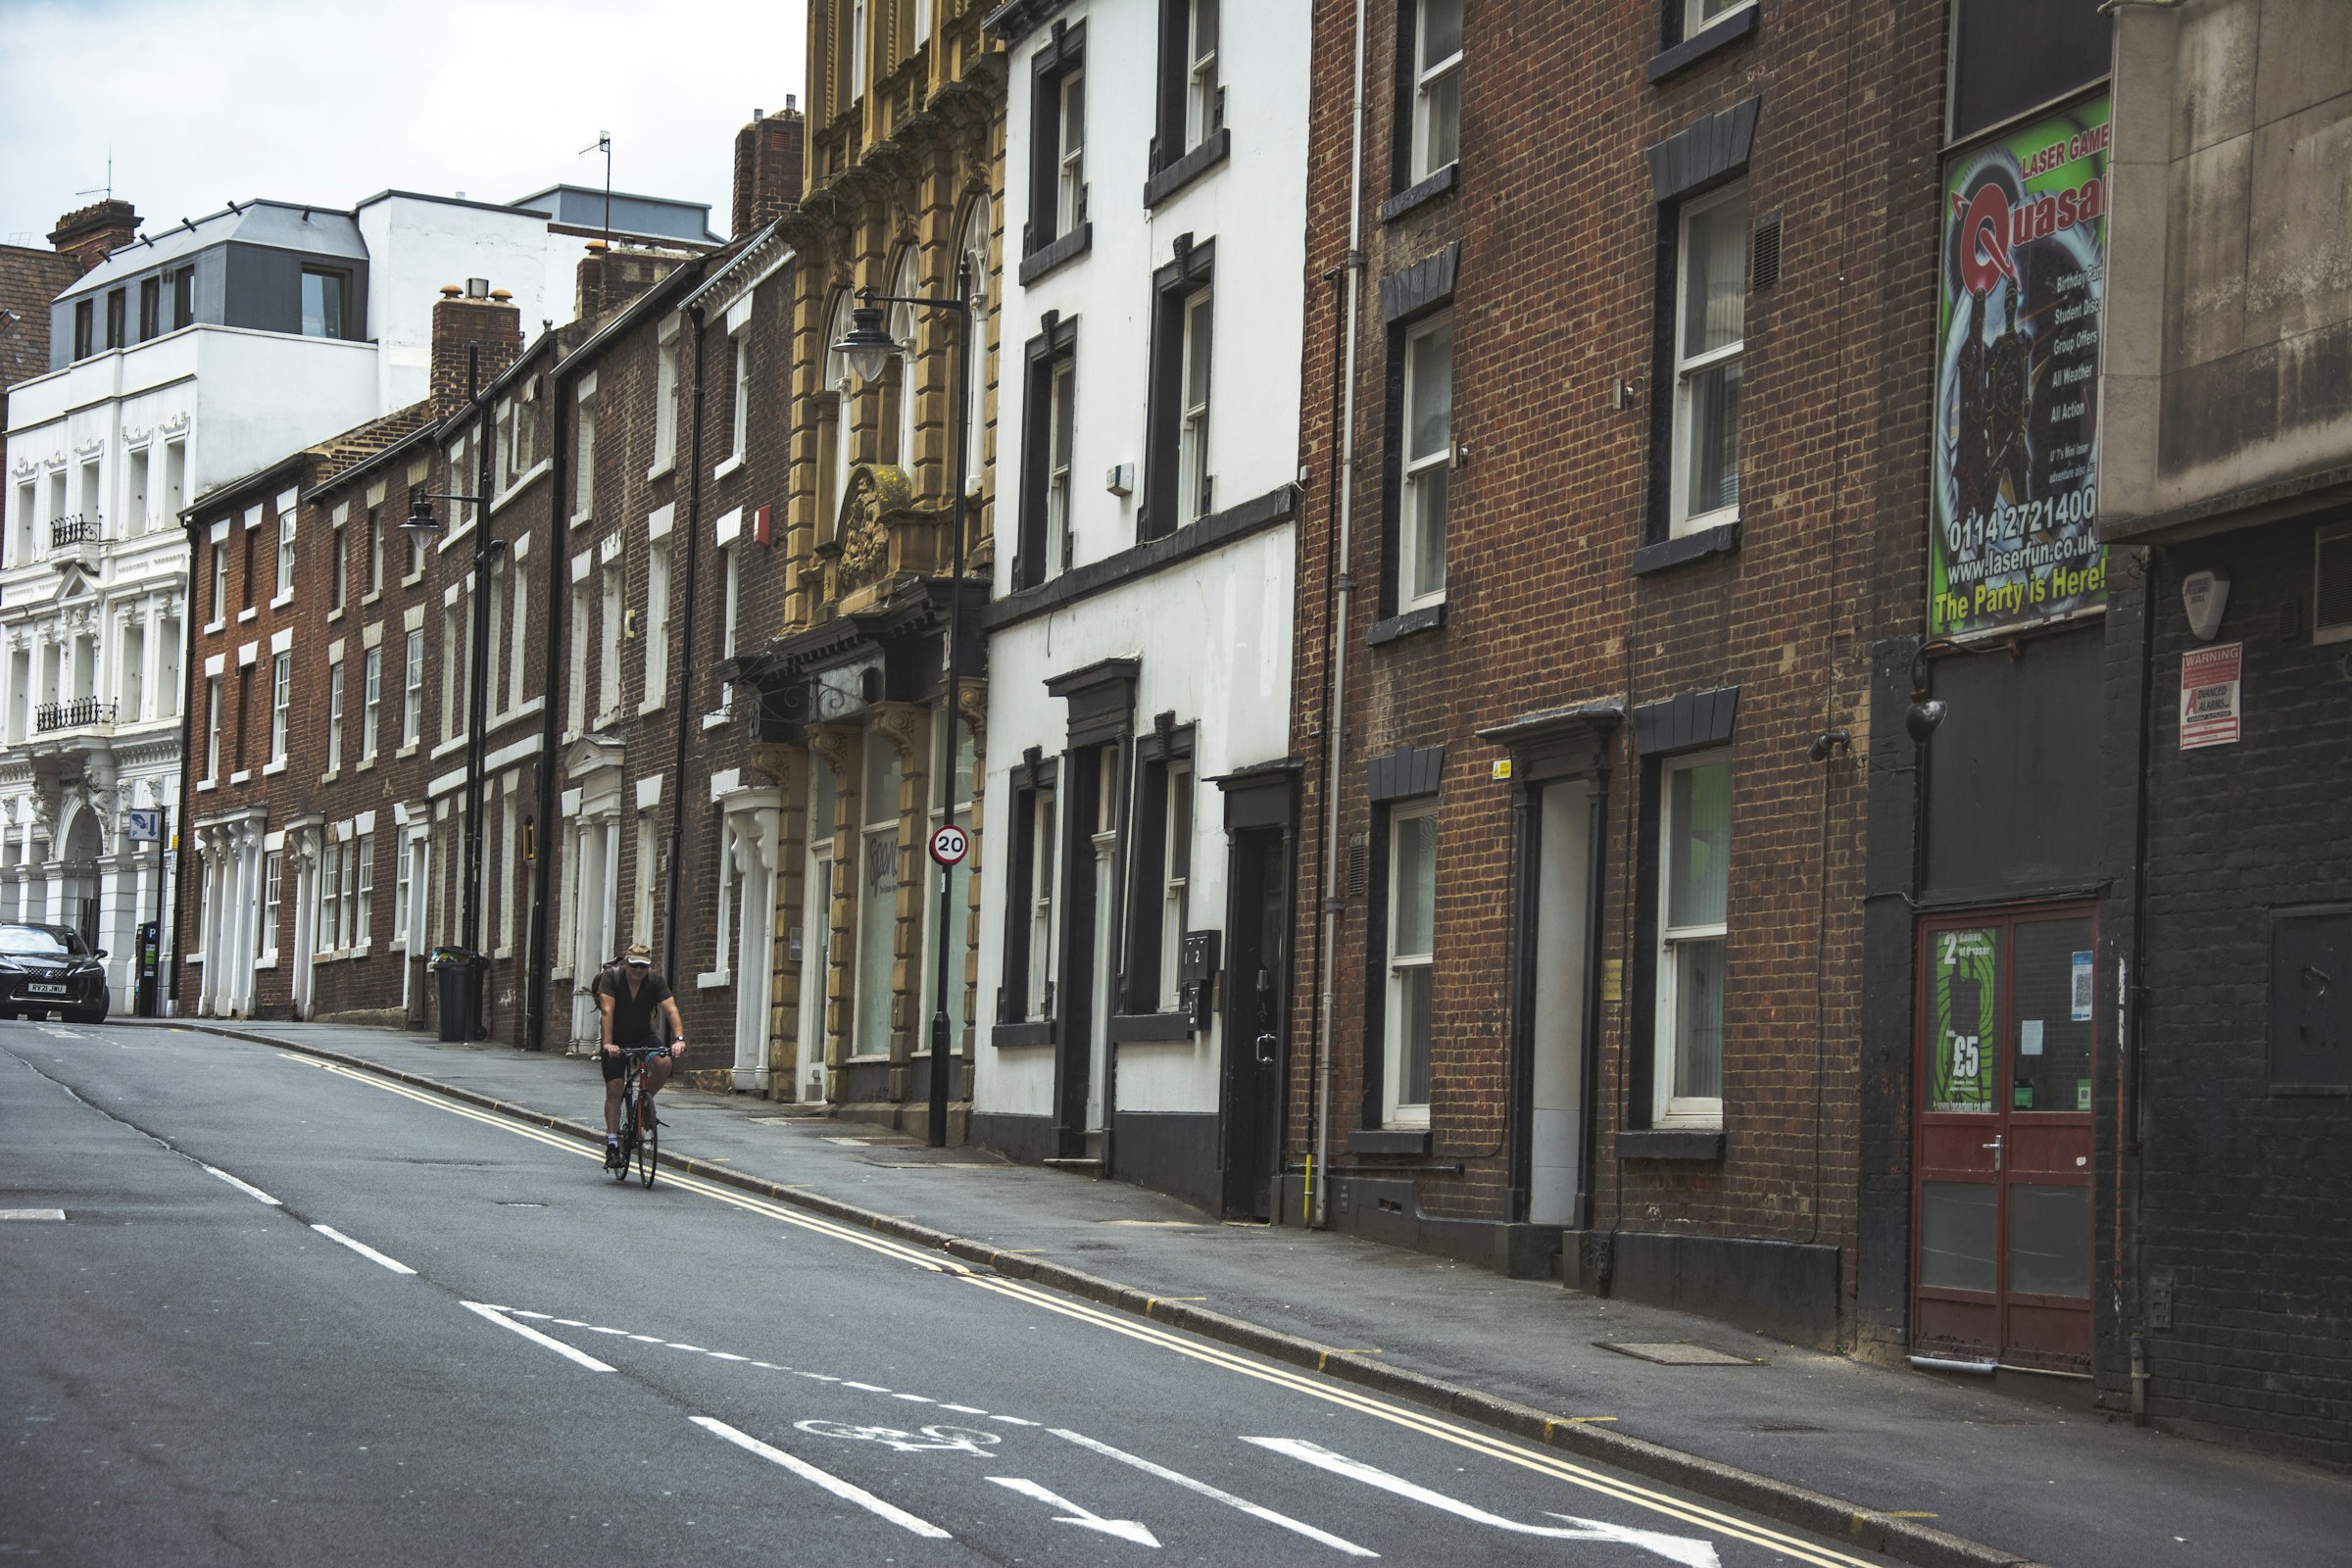
Sheffield is a city of villages, and where you live shapes almost everything else about your time here. The area finder scores all 147 neighbourhoods on six things and lets you rank them by what you actually care about.
It exists because the honest answer to “where should I live in Sheffield” was always guesswork, plus whichever area the person answering happened to know.
The six scores
- Quiet: how much of the area sits inside the road and rail noise bands, and how much traffic passes through it.
- Green: parks, nature sites, street trees, woodland and playgrounds per square kilometre.
- Connected: bus stops per head, distance to the nearest tram stop and station, and broadband coverage.
- Affordable: sold prices against the city for the same mix of homes, and how much of the area is rented.
- Lively: events, venues, pubs and community places per thousand residents.
- Served: GP distance, pharmacies, primary school places, the nearest library, defibrillators and toilets.
How to read a score
Each one is a percentile against the rest of Sheffield, so 80 for quiet means quieter than four fifths of the city on the inputs used. It is a ranking, not a measurement: a score of 80 does not mean an area is quiet in absolute terms, only that most of Sheffield is noisier.
Click any score and it opens the workings: which numbers went in, what they were, and where each one came from. If you disagree with a result, that is the page to argue with.
What is deliberately missing
Safety is not scored. The public crime feed available to us does not carry street level records for this, and a safety number built on the wrong data would be worse than no number at all. Schools are counted as places, not ranked on results. None of this replaces walking round an area on a wet Tuesday.
Using it
Tick quiet and green, ask for a tram stop, and you get a shortlist. Open any area and you get its radar chart, the areas most like it, and the whole picture of the place, from the next events to the state of the river.
The scores are my own working rather than anybody’s official statistic, licensed CC BY 4.0, and you can download all of them from the developers page or read how they are built in the open data guide. If you think one is wrong, tell me, and bring the number.