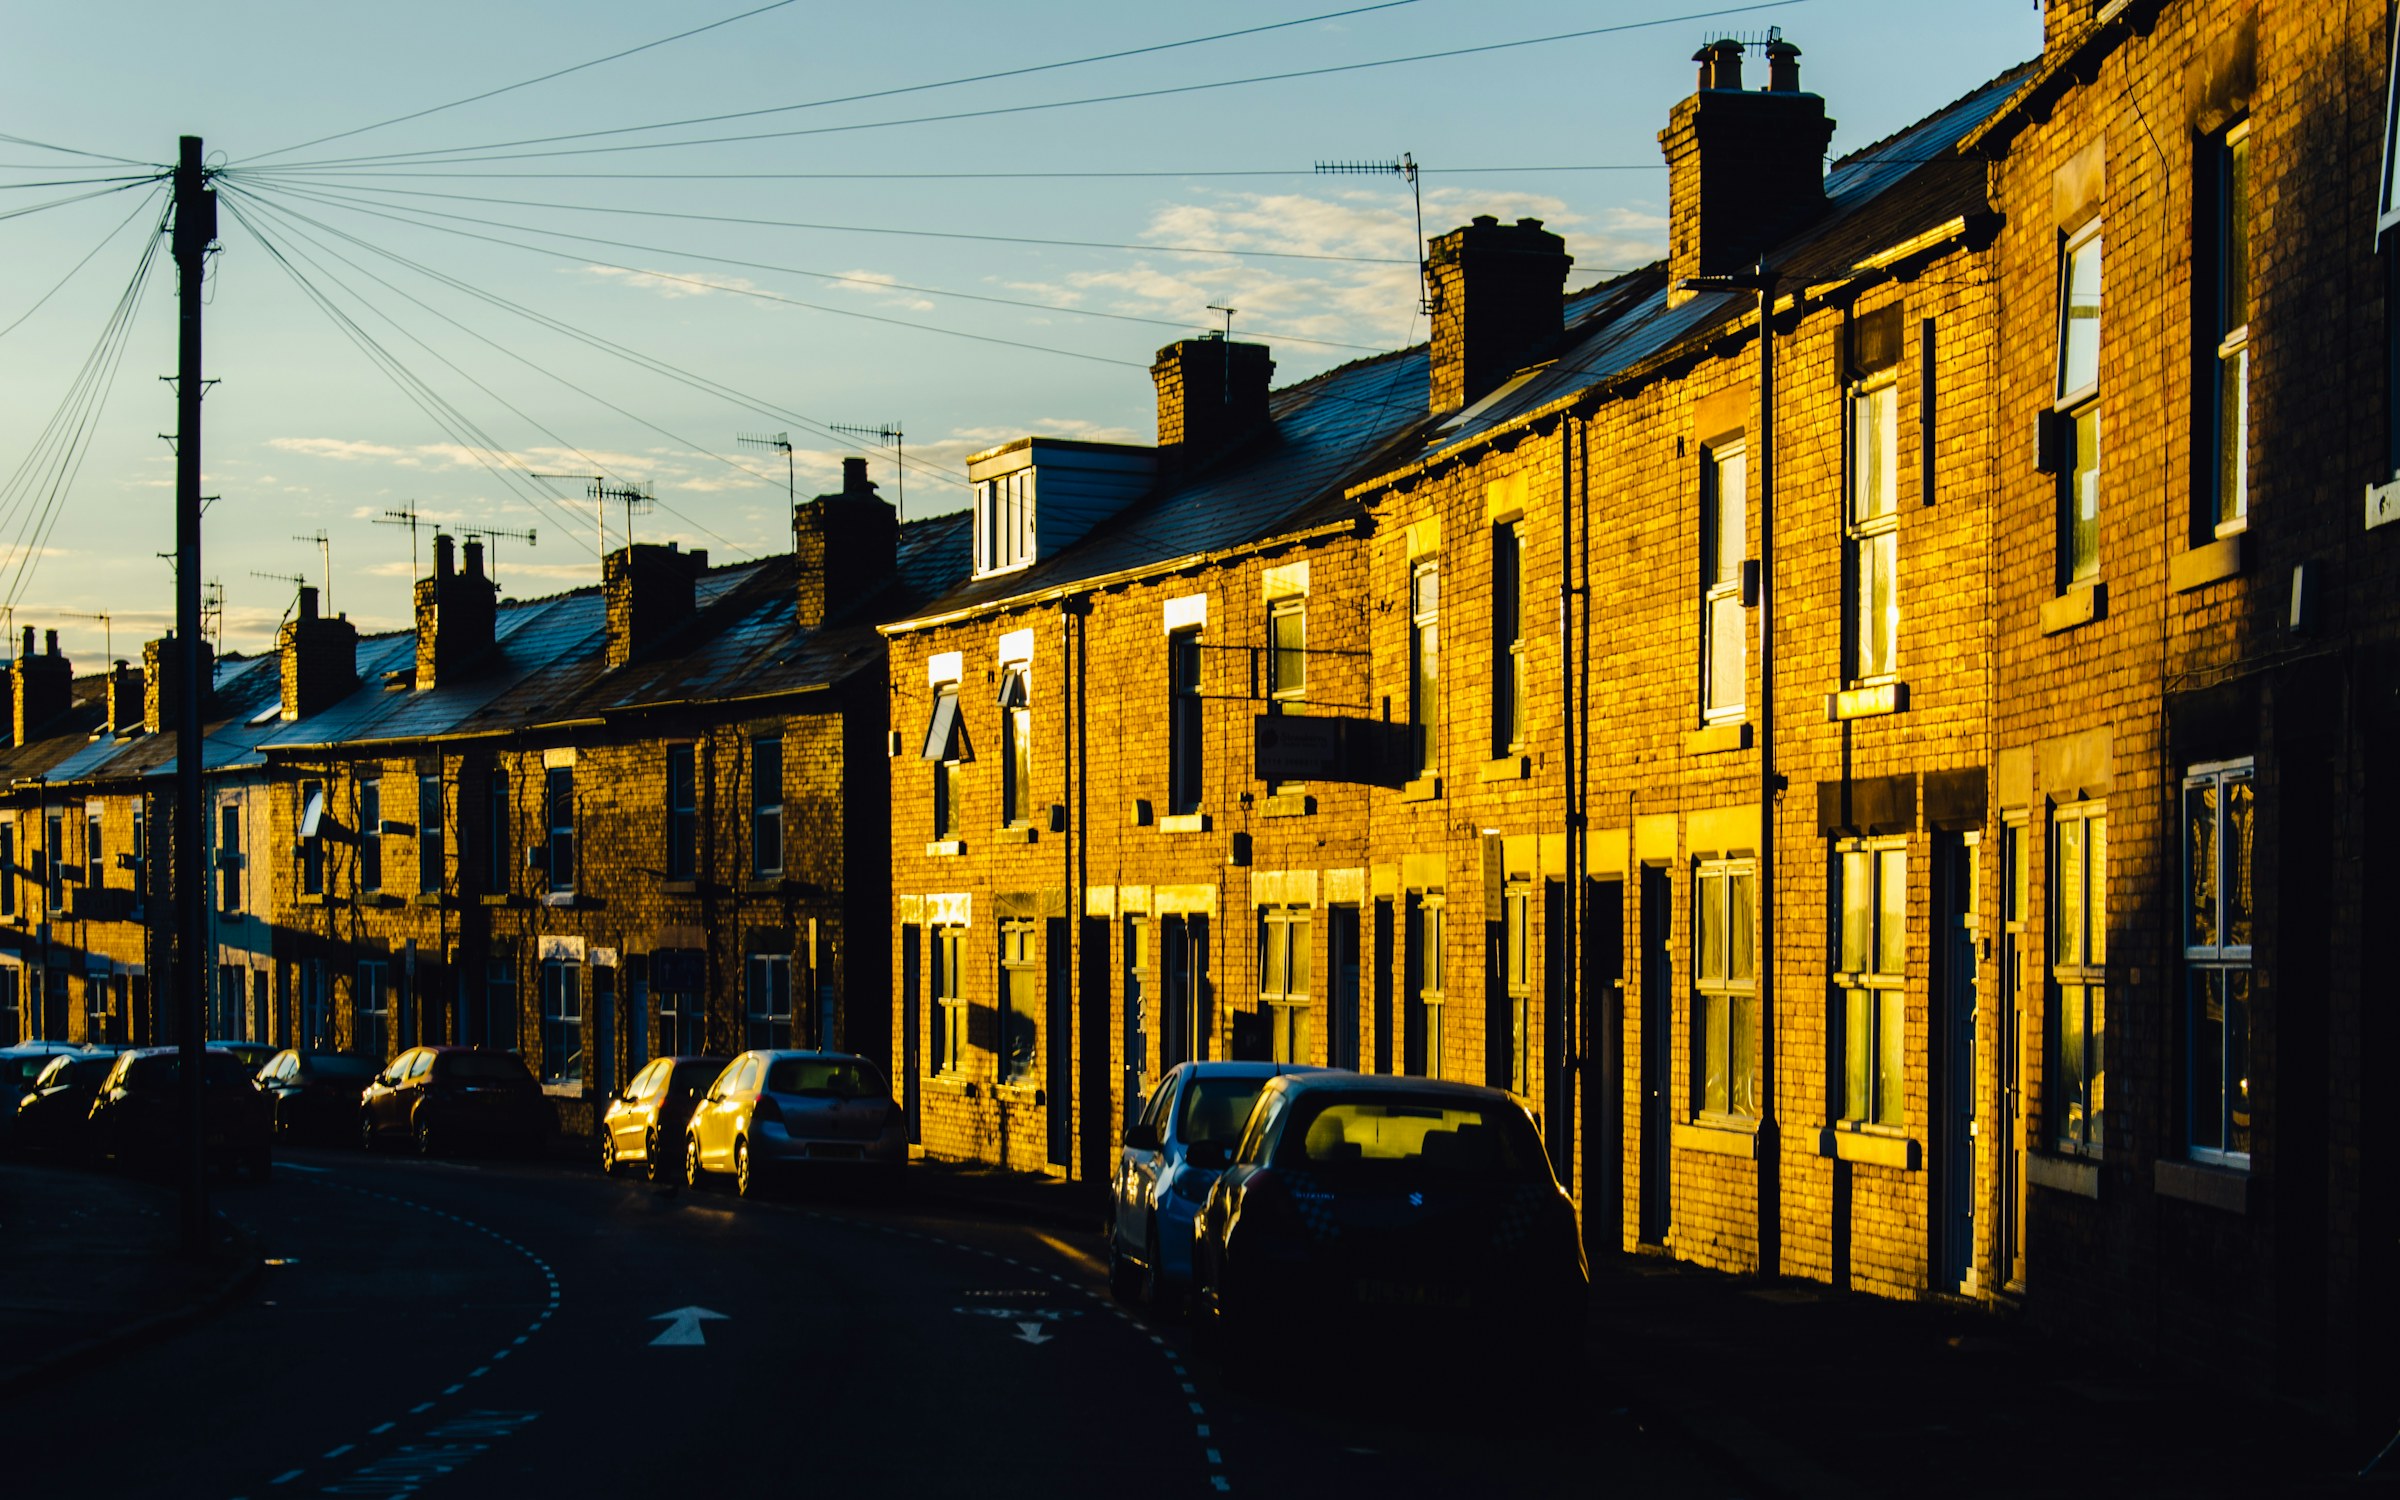
Photograph: Shane Rounce on Unsplash
Local context and safer renting
Housing in Sheffield
Understand an area, know the checks to make and find local support before you commit to a room or home.
Before you rent, buy or move in
Check any Sheffield postcode
One page about that exact spot: what homes cost and how many are rented, whether it is noisy, how the neighbourhood measures for deprivation, flooding, air, policing and recorded crime, the nearest GP, pharmacy, dentist and school, the stops you can walk to, green space, food hygiene, planning going through, and what actually happens there. Or ask about the street instead and get what is affecting it right now. Every figure names its source and its date, and anything we do not hold says so.
Built from the stored open-data snapshots listed on each answer. Postcode positions from postcodes.io, Open Government Licence v3.0.
Before you pay
Six checks worth making
A viewing and a written agreement matter more than a convincing message or a rushed deadline.
See the home
Visit in person where you safely can. Never rely only on photographs, video or a social profile.
Check who is letting it
Ask the landlord or agent to show who they are and that they have authority to let the property.
Read the whole agreement
Check the rent, bills, deposit, term, notice rules and every fee before signing or transferring money.
Protect the deposit
For most private tenancies the landlord must protect the deposit in a government-backed scheme and provide the prescribed information.
Check safety documents
Ask for the energy certificate, gas-safety record where gas is fitted, electrical report and smoke or carbon-monoxide alarm information.
Keep a record
Save the advert, agreement, inventory, receipts and messages. Photograph the condition and meter readings when you move in.
Use this practical checklist alongside tenancy-specific legal advice and the current rules for your agreement. Check the current private-renting guidance on GOV.UK.
Local area links
Start with the area
Explore places already connected to local events and venues. Counts show how much local Sheffield Events content is tagged to each area.
Local support
Housing organisations in the directory
These are published Charity Commission records classified under accommodation and housing. Check the organisation’s own details before relying on a service.
Africa United
Africa United works to improve the lives of African people and other minority communities in Sheffield and neighbouring towns. AU provides free…
Ashiana Sheffield
Ashiana has over thirty years' experience of working with Black, Asian, Minority Ethnic & Refugee (BAMER) adults, children & young people fleeing…
Assist Sheffield
The relief of Asylum Seekers who are in conditions of need, hardship or distress.The advancement of the education of the public, and…
Autism Plus Limited
The charity provides Residential and Supported Living services for adults with autism and other disabilities. Other key associated services includes Adult Learning,…
Butchers and Drovers Charitable Institution
The BDCI (Butchers' and Drovers' Charitable Institution) is the meat industry's own trade charity. It exists to provide support for those who…
Causeway Charitable Services
Causeway supports marginalised and vulnerable people to recover from trauma and develop safe and fulfilling futures. Our modern slavery and crime reduction…
Council tenants and applicants
Neighbourhood housing offices
Sheffield City Council’s local housing offices, with the published opening times and contact for each area.
First Point at Burngreave
Sheffield City Council First Point Sorby House 42 Spital Hill Sheffield S4 7LG
Open: Monday, Tuesday, Thursday and Friday, 10am to 4pm
First Point at Chapeltown
First Point 1B Station Road Chapeltown Sheffield S35 2XE
Open: Monday, Tuesday, Wednesday and Friday, 9am to 4pm. Closed on Thursdays.
First Point at Crystal Peaks
Crystal Peaks Library 1 – 3 Peak Square Peaks Mount Sheffield S20 7PH
Open: Monday, Tuesday, Wednesday and Friday, 9am to 4pm.
First Point at Hillsborough
First Point Unit 7 Hillsborough Barracks Shopping Mall Langsett Road Sheffield S6 2LR
Open: Monday, Tuesday, Thursday and Friday, 9am to 4pm.
First Point at Manor Library
Manor Library Ridgeway Road Sheffield S12 2SS
Open: Monday, Tuesday, Wednesday and Friday, 10am to 1pm and 1:30pm to 4pm.
Newfield Green Housing Office
Sheffield City Council Local Area Housing Office 607 Gleadless Road Sheffield S2 2BT
Open: Monday, Tuesday, Thursday and Friday, 9am to 4pm.
Stocksbridge Housing Office
Housing Office, Stocksbridge Town Hall, Manchester Road, Stocksbridge, Sheffield, S36 2DT
Open: Tuesday, 9:30am to 12:30pm and 1pm to 4pm; Thursday, 9:30am to 12:30pm
The Sheffield Property Shop Housing Office
Sheffield City Council First Point Howden House 1 Union Street Sheffield S1 2SH
Open: Monday to Tuesday, from 9am to 5pm; Wednesday, from 1pm to 5pm; Thursday to Friday, from 9am to 5pm
Wordsworth Avenue Housing Office
Local Area Housing Office 333 Wordsworth Avenue Sheffield S5 8NH
Open: Monday, Wednesday and Friday, 9am to 4pm.
Source: Sheffield City Council open data, Open Government Licence v3.0. Check the council’s own page before travelling; office arrangements change. Checked 19 Oct 2026. Dataset record
Worried about losing your home or unsafe tonight?
Use Help near you for foodbanks, community venues and support contacts. For urgent housing advice, use the council or Shelter’s current guidance rather than waiting for a listing here.
Useful next steps
Check the wider neighbourhood
Living here 10 cards
Census 2021
Homes and cars
Tenure and car ownership for the 231,994 households counted in Sheffield at the 2021 census.
Tenure
- Owned outright
- 31%
- Owned with a mortgage
- 27.3%
- Shared ownership
- 0.3%
- Council rented
- 15.6%
- Other social rented
- 7%
- Private rented
- 16.8%
- Other private rented
- 1.9%
- Lives rent free
- 0.1%
Cars and vans
- No car
- 29.2%
- One car
- 42.5%
- Two cars
- 22.1%
- Three or more
- 6.2%
Most car-free neighbourhoods
Share of households with no car or van. Across Sheffield it was 29.2%.
- Netherthorpe 67.7% 1,280 households
- Cathedral Quarter 67.3% 909 households
- Little Sheffield 63.6% 817 households
- Saint Vincent's and Shalesmoor 62.9% 1,500 households
- Upperthorpe 54.8% 1,712 households
- Newfield Green 54.3% 1,478 households
Where private renting is most common
Share of households renting privately. Across Sheffield it was 18.7%.
- Cathedral Quarter 73.4% 909 households
- Saint Vincent's and Shalesmoor 69.4% 1,499 households
- Neepsend 64.2% 1,057 households
- Wicker 57.2% 915 households
- Sharrow Vale 56.3% 1,175 households
- Lowfield 54.4% 1,312 households
Source: Office for National Statistics, Census 2021, via Nomis, Open Government Licence v3.0. Neighbourhood figures sum the census areas whose population-weighted centres (ONS Open Geography, contains OS data © Crown copyright and database right 2026) fall inside each boundary. Census 2021 on Nomis · All data sources
Deprivation
How deprivation is spread across Sheffield
Sheffield has 345 small areas (LSOAs). The 2019 Index of Multiple Deprivation ranks every LSOA in England; 82 of Sheffield's sit in the most deprived tenth nationally and 34 in the least deprived tenth, one of the widest spreads of any English city.
Every small area on the Sheffield map, coloured by decile
Deprivation: English Indices of Deprivation 2019 by LSOA (MHCLG) with ONS population-weighted centroids, Open Government Licence v3.0. Decile 1 is the most deprived tenth of England. Indices of Deprivation 2019 · ONS Open Geography Portal · All data sources
Department for Education
School absence in Sheffield, 2024/25
Persistent absence (10% or more of sessions missed): 21.3% of pupils in Sheffield in 2024/25, against 18.1% across England. Severe absence (50% or more of sessions missed): 3.7% of pupils in Sheffield in 2024/25, against 2.4% across England. All state-funded schools; the figures are for the whole local authority, not any one school.
Contains Department for Education data from the Explore education statistics API, licensed under the Open Government Licence v3.0. Data set: Absence for persistent and severe absentees (version 1.0), published 26 Mar 2026, Sheffield local authority (E08000019) and England. Checked 10 Oct 2026. Pupil absence in schools in England · Open Government Licence v3.0 · All data sources
Office for National Statistics
Renting in Sheffield: what a private rent costs
Average monthly rents for private tenants in Sheffield in August 2026, from the Price Index of Private Rents. The figures cover the whole city and describe rents paid by all private tenants, not just new lets, so a home advertised today will usually ask more. These are official statistics in development: the ONS is still refining the method, and figures for recent months can be revised.
- Average private rent in Sheffield
- £931 a monthAugust 2026
- Change on a year earlier
- +4.3%August 2026
- Rent index, January 2023 = 100
- 124.2August 2026
- Yorkshire and The Humber average
- £865, +4.9%August 2026
- United Kingdom average
- £1,400, +3.8%August 2026
By number of bedrooms
- One bedroom · £690 a month+4.1% on a year earlier
- Two bedrooms · £840 a month+4.2% on a year earlier
- Three bedrooms · £967 a month+4.7% on a year earlier
- Four or more bedrooms · £1,339 a month+3.7% on a year earlier
By property type
- Detached · £1,233 a month+3.7% on a year earlier
- Semi-detached · £990 a month+4.7% on a year earlier
- Terraced · £923 a month+4.5% on a year earlier
- Flat or maisonette · £774 a month+3.9% on a year earlier
Source: Office for National Statistics licensed under the Open Government Licence v3.0. Price Index of Private Rents, UK: monthly price statistics, official statistics in development. Edition 16 September 2026. Checked 19 Oct 2026. Next release 21 October 2026. Dataset · ONS bulletin · All data sources
Ministry of Housing, Communities and Local Government
Sheffield's 252,656 homes
The official estimate of every home in Sheffield at 31 March 2025, who owns it, and how many stand empty. Private homes are owner occupied or privately rented; housing association homes are those of private registered providers of social housing.
- Council homes
- 38,15315.1% of homes
- Housing association homes
- 17,9067.1% of homes
- Private homes
- 196,53177.8% of homes
- Empty homes
- 7,1962.8% of homes, 6 October 2025
- Empty for more than six months
- 2,6516 October 2025
- Empty council homes
- 71731 March 2025, 1.9% of council homes
| Tenure | Homes at 31 March 2025 |
|---|---|
| Council | 38153 homes |
| Housing association | 17906 homes |
| Other public sector | 66 homes |
| Private | 196531 homes |
| Year | All empty homes | Empty for more than six months |
|---|---|---|
| 2004 | 8884 homes | 3559 homes |
| 2005 | 8182 homes | 3678 homes |
| 2006 | 8248 homes | 3878 homes |
| 2007 | 8554 homes | 3557 homes |
| 2008 | 8894 homes | 3629 homes |
| 2009 | 8188 homes | 3229 homes |
| 2010 | 8147 homes | 3345 homes |
| 2011 | 7699 homes | 3328 homes |
| 2012 | 6714 homes | 2719 homes |
| 2013 | 6156 homes | 2409 homes |
| 2014 | 5583 homes | 2186 homes |
| 2015 | 6092 homes | 2095 homes |
| 2016 | 5724 homes | 1995 homes |
| 2017 | 6209 homes | 2204 homes |
| 2018 | 6387 homes | 2433 homes |
| 2019 | 6606 homes | 2482 homes |
| 2020 | 6404 homes | 2862 homes |
| 2021 | 6763 homes | 2838 homes |
| 2022 | 7116 homes | 2702 homes |
| 2023 | 7301 homes | 2644 homes |
| 2024 | 7423 homes | 2453 homes |
| 2025 | 7196 homes | 2651 homes |
The council tax list, 6 October 2025
- Homes on the list
- 262,909every separately banded home, student cluster flats included
- Exempt from council tax
- 18,175
- Exempt because students live there
- 14,12277.7% of exemptions
- Empty and exempt
- 2,166for example awaiting probate, repossessed or left for care
- Empty and charged the empty homes premium
- 1,490
- Second homes
- 937
Stock figures are estimates built on the census and yearly net additions, provisional from 2022. Empty homes are counted from council tax records on the first Monday in October; council and housing association vacants on 31 March. Sheffield took a new area code after a small boundary change with Barnsley on 1 April 2025, and the two codes are joined here as one series. The 2025 figures are provisional.
Contains public sector information from the Ministry of Housing, Communities and Local Government (live tables on dwelling stock and vacants, and the Council Taxbase), Licensed under the Open Government Licence v3.0. Checked 19 Oct 2026. Live tables on dwelling stock · Council Taxbase · All data sources
Ofcom Connected Nations 2025
Broadband and mobile across Sheffield
268,249 premises in the Sheffield local authority area, as reported to Ofcom for July 2025 and published 19 November 2025.
- Gigabit-capable
- 93%
- Full fibre available
- 91%
- Full-fibre take-up
- 42% of all premises
- 300 Mbit/s or faster
- 94%
- Superfast (30 Mbit/s or faster)
- 98%
- Below the broadband USO
- 38 premises
Mobile coverage is published for Sheffield as a whole: outdoor 4G from all four operators reaches 99.8% of premises, 5G from at least one operator 99.7%, and a good outdoor 4G or 5G signal from every operator 96.1%.
Highest gigabit availability
- Richmond 100% 2,748 premises
- Woodthorpe 100% 2,364 premises
- Frecheville 100% 2,235 premises
- Shirecliffe 100% 1,977 premises
- Longley 100% 1,621 premises
- Charnock 100% 1,476 premises
Lowest gigabit availability
- Bradfield 0% 385 premises
- Little Sheffield 42% 749 premises
- Endcliffe 46% 861 premises
- Cultural Industries Quarter 50% 2,131 premises
- Sandygate 51% 1,342 premises
- Castlegate 55% 970 premises
Neighbourhood figures need at least 300 premises. Every neighbourhood page shows its own availability shares beside the Sheffield figure. Browse the neighbourhoods
Source: Ofcom Connected Nations 2025 data downloads (data for July 2025, published 19 November 2025), Ofcom copyright, reproduced under Ofcom's terms of use and the Open Government Licence v3.0. Output areas placed with ONS Open Geography lookups and population-weighted centroids, contains OS data © Crown copyright and database right 2026. Ofcom Connected Nations 2025 data · All data sources
Completed sales, last twelve months
What Sheffield homes actually sold for
Completed sales registered from 20 Oct 2025 to 28 Aug 2026. 4,549 standard sales with a Sheffield postcode.
- Median price
- £215,000
- Middle half of sales
- £160,250 to £300,000
- Detached
- £360,000 807 sales
- Semi-detached
- £217,750 1,735 sales
- Terraced
- £191,000 1,403 sales
- Flat or maisonette
- £140,000 604 sales
Highest neighbourhood medians
Lowest neighbourhood medians
- Osgathorpe £72,500 8 sales
- Page Hall £78,500 12 sales
- Wicker £84,000 7 sales
- Tinsley £84,000 16 sales
- Saint Vincent's and Shalesmoor £88,975 12 sales
- Firshill £105,000 6 sales
Neighbourhood figures need at least 5 sales. Every neighbourhood page shows its own sales, quartiles and the most recent street-level completions. Browse the neighbourhoods
Contains HM Land Registry data © Crown copyright and database right 2026. This data is licensed under the Open Government Licence v3.0. Medians use standard sales only; the Land Registry’s additional category (for example buy-to-let and repossessions) is excluded. These are actual registered sales, not the mix-adjusted UK House Price Index estimate. Data is published one to two months in arrears and does not include every sale. Checked 18 Oct 2026. Price Paid Data · All data sources
| Point | Sheffield LSOAs |
|---|---|
| 1 (most deprived) | 82 |
| 2 | 36 |
| 3 | 26 |
| 4 | 22 |
| 5 | 31 |
| 6 | 31 |
| 7 | 26 |
| 8 | 27 |
| 9 | 30 |
| 10 (least deprived) | 34 |
Getting around 2 cards
Traffic on Sheffield's roads
- M1 southbound between J31 and J32: 68,997 vehicles on Mon 29 Jun · average 65 mph · 27.7% large vehicles
- M1 34 to 34: 138,072 motor vehicles a day (2025) · estimated
- M1 34 to 35: 136,926 motor vehicles a day (2025) · counted
- M1 35 to LA boundary: 127,194 motor vehicles a day (2025) · counted
| Point | M1 34 to 34 | M1 34 to 35 | M1 35 to LA boundary | M1 LA Boundary to 34 | A630 A57 to B6200 Handsworth Rd |
|---|---|---|---|---|---|
| 2016 | 116638 | 110621 | 109873 | 86257 | 67307 |
| 2017 | 115119 | 108628 | 108345 | 89901 | 67447 |
| 2018 | 117215 | 110608 | 109206 | 106074 | 69941 |
| 2019 | 118486 | 111899 | 112506 | 112507 | 71554 |
| 2020 | 92355 | 87085 | 89915 | 68119 | 55994 |
| 2021 | 110715 | 107134 | 112132 | 81535 | 59141 |
| 2022 | 119699 | 116168 | 114327 | 87480 | 63023 |
| 2023 | 123011 | 118955 | 136598 | 98694 | 73617 |
| 2024 | 124031 | 119733 | 137487 | 110951 | 64959 |
| 2025 | 138072 | 136926 | 127194 | 112934 | 72654 |
Environment and sky 1 card
Road and rail noise across Sheffield
Defra's strategic noise maps model annual average noise (Lden) from roads and railways. The table shows how much of the Sheffield area falls in each band; anything under 55 dB is not mapped.
| Band (Lden) | Road, km² | Rail, km² |
|---|---|---|
| 75 dB or more | 14.3 | 0.8 |
| 70 to 75 dB | 24.9 | 3.5 |
| 65 to 70 dB | 46.9 | 5.1 |
| 60 to 65 dB | 88.7 | 9.0 |
| 55 to 60 dB | 166.6 | 15.3 |
Council and democracy 4 cards
Planning
Recent planning applications
- UndecidedThe Chimes 18 Vicar Lane City Centre Sheffield S1 2EH
- Undecided24 Cooks Wood Road Sheffield S3 9AB
- Undecided15 Lyndhurst Road Sheffield S11 9BJ
- Undecided83 Townhead Road Sheffield S17 3GE
- Undecided78 Mill Road Sheffield S35 9XQ
- Undecided19 Chelsea Road Sheffield S11 9BQ
- Undecided12 Broomgrove Road Sheffield S10 2LR
- Undecided49 Twentywell Road Sheffield S17 4PU
Every recent application on the Sheffield map · Search all Sheffield applications on UK PlanIt
Planning applications: UK PlanIt, aggregated from Sheffield City Council. Check the council record before relying on any detail; documents are linked, never copied. UK PlanIt · All data sources
Planning constraints
Brownfield land and conservation areas
The brownfield land register lists 667 previously developed sites in Sheffield put forward for housing, covering about 357.7 hectares; 521 already hold planning permission. 39 conservation areas touch the city, where extra planning rules protect the character of the streets.
- Brownfield sites
- 667
- Hectares
- 357.7
- With permission
- 521
- Conservation areas
- 39
The ten biggest sites on the register
- Former Steins Tip, Station Road, Deepcar
- Bannerdale Centre & Park Site, Carter Knowle Road
- Site Of Properties At Scowerdons Drive, Silkstone Road, Spa Brook Drive, Wickfield Close (Scowerdons Phases 1b, 1c,2, 4,5, 6)
- Parson Cross College (SW) – Remington Rd/ Monteney Rd New Parson Cross Masterplan Area
- Site A Stocksbridge Steelworks
- Manor Boot Houses
- Darnall Works
- Newstead Estate, Birley
- Manor 12 & 13 Harborough Avenue (The Circle / Fretson Road)
- Former Outokumpu Steelworks off Ford Lane, North of Manchester Road, Stocksbridge
1 article 4 direction area on the platform touches Sheffield: OS 2200 and 3600 at West Nab, Wortley (1973). Sheffield City Council's own directions, including the one on houses in multiple occupation, have yet to be published there.
The brownfield land dataset on planning.data.gov.uk · Conservation areas by neighbourhood
Contains planning.data.gov.uk data published by Sheffield City Council and neighbouring planning authorities under the Open Government Licence v3.0; conservation area boundaries © Historic England, containing Ordnance Survey data © Crown copyright and database right. Open Government Licence v3.0. Checked 10 Oct 2026. planning.data.gov.uk · All data sources
Draft Sheffield Plan
Where Sheffield plans to build
The draft Sheffield Plan allocates 293 sites for development up to 2039. 240 of them would take new homes, 26,364 in all, and 76% of those homes are planned on brownfield land. The rest are workplaces, mixed use and leisure.
- Allocated sites
- 293
- Homes planned
- 26,364
- Sites with homes
- 240
- Homes on brownfield
- 76%
- Greenfield sites
- 51
The biggest housing sites
- HC07 Buildings at Wellington Street and Trafalgar Street, S1 4HFStrategic Housing Site · 1,015 homes · 0.31 ha · brownfield
- SES29 Handsworth Hall Farm, Land at Finchwell, Road, S13 9ASStrategic Mixed Use Site · 870 homes · 56.40 ha · greenfield
- SES30 Bramley Lane/Beaver Hill Road, HandsworthStrategic Housing Site · 827 homes · 35.28 ha · greenfield
- HC08 Moorfoot Building, The Moor, S1 4PHStrategic Housing Site · 714 homes · 1.79 ha · brownfield
- HC03 Land and buildings at St Mary's Gate and Eyre Street, S1 4QZStrategic Mixed Use Site · 650 homes · 1.60 ha · brownfield
- NES37 Land between Creswick Avenue and Yew, Lane, S35 8QNStrategic Housing Site · 592 homes · 29.80 ha · greenfield
- KN36 Land at Penistone Road and Rutland Road, S3 8DGStrategic Housing Site · 572 homes · 3.07 ha · brownfield
- CH05 Chapeltown Road, Chapeltown/EcclesfieldStrategic Housing Site · 549 homes · 19.62 ha · greenfield
- CW03 West Bar Square, S3 8NWStrategic Mixed Use Site · 525 homes · 3.13 ha · brownfield
- ES22 Attercliffe Canalside, Land to the north of Worthing Road, S9 3JNStrategic Housing Site · 476 homes · 4.73 ha · greenfield
Most homes planned by neighbourhood: Saint Vincent's and Shalesmoor (2,933 homes) · Devonshire Quarter (2,334 homes) · The Moor (1,826 homes) · Neepsend (1,818 homes) · Handsworth (1,724 homes)
This is the draft Sheffield Plan as amended by the Main Modifications, not an adopted plan. After the spring 2026 consultation the Inspectors asked the council for a further round of changes, the Further Main Modifications, before they write their final report, so sites, boundaries and capacities can still change. Until the plan is adopted, planning decisions still rest on the Core Strategy (2009) and the saved Unitary Development Plan policies (1998). The Further Main Modifications consultation is open until 5pm on 28 October 2026. The Sheffield Plan, its examination and how to respond
Site allocations: Sheffield City Council, Main Modifications Sheffield Plan Policies Map, under the Open Government Licence v3.0. Contains Ordnance Survey data © Crown copyright and database right. Checked 12 Oct 2026. Dataset: Site Allocation · All data sources
| Point | Applications lodged |
|---|---|
| 3 Aug | 67 |
| 10 Aug | 60 |
| 17 Aug | 42 |
| 24 Aug | 49 |
| 31 Aug | 48 |
| 7 Sep | 65 |
| 14 Sep | 67 |
| 21 Sep | 52 |
| 28 Sep | 58 |
| 5 Oct | 76 |
| 12 Oct | 30 |
| 19 Oct | 2 |
Money and energy 5 cards
Cheaper, greener electricity today
Greenest time to charge today
23:30 to 01:30
About 13 gCO2/kWh, the lowest two hours in the next day. Right now the Yorkshire grid is low carbon at 69 gCO2/kWh; the dirtiest half hour is 09:00 at 80.
Cheapest electricity half hours on Agile
The rest of today, Yorkshire Agile Octopus unit rates including VAT. Tomorrow appears after 4pm.
- 22:30 to 23:00: 9.2p/kWh
- 22:00 to 22:30: 12.5p/kWh
- 21:30 to 22:00: 18.1p/kWh
- 21:00 to 21:30: 23.2p/kWh
- 20:30 to 21:00: 24.7p/kWh
- 20:00 to 20:30: 28.7p/kWh
Great Britain is generating
23.4 GW
At 05:30: 51% wind, 21% nuclear, 13% biomass, 11% gas. Demand 21.9 GW.
Cheapest petrol and diesel near you
11 forecourts across Sheffield with prices submitted in the last week through Fuel Finder. Pence per litre.
Unleaded (E10)
- 169.9p Morrisons MFG MORRISONS SHEFFIELD MEADOWHEAD, SHEFFIELD S8 7UE
- 169.9p Texaco SGN – BIRLEY MOOR, SHEFFIELD S12 4WH
- 169.9p Cecil Penney Ltd cecil penney ltd, SHEFFIELD S36 6HF
- 171.9p Tesco SHEFFIELD DINNINGTON SUPERSTORE – PETROL FILLING STATION, SHEFFIELD S25 2PF
- 172.9p Asda Sheffield Manor Top Supermarket ASDA SHEFFIELD MANOR TOP SUPERMARKET, SHEFFIELD S12 2AB
- 172.9p Total Harvest Energy Coal Aston EG COAL ASTON PFS, SHEFFIELD S18 3AA
- 172.9p Esso CHAPELTOWN ESSO EXPRESS, SHEFFIELD S35 1SA
- 172.9p BP Beighton Park Service Station, SHEFFIELD S20 1DP
Diesel (B7)
- 192.9p Valero Marsh Lane Filling Station, SHEFFIELD S21 4BQ
- 195.9p Sainsbury's SAINSBURYS ARCHER ROAD, SHEFFIELD S8 0TD
- 195.9p Morrisons MFG MORRISONS SHEFFIELD MEADOWHEAD, SHEFFIELD S8 7UE
- 195.9p Texaco SGN – BIRLEY MOOR, SHEFFIELD S12 4WH
- 197.9p Eg On The Move EG SHEFFIELD PFS, SHEFFIELD S2 1GE
- 197.9p Asda Sheffield Manor Top Supermarket ASDA SHEFFIELD MANOR TOP SUPERMARKET, SHEFFIELD S12 2AB
- 197.9p Esso CHAPELTOWN ESSO EXPRESS, SHEFFIELD S35 1SA
- 197.9p Tesco SHEFFIELD DINNINGTON SUPERSTORE – PETROL FILLING STATION, SHEFFIELD S25 2PF
| Point | Forecast gCO2/kWh, Yorkshire |
|---|---|
| 08:00 | 69 gCO2/kWh |
| 08:30 | 69 gCO2/kWh |
| 09:00 | 80 gCO2/kWh |
| 09:30 | 71 gCO2/kWh |
| 10:00 | 69 gCO2/kWh |
| 10:30 | 71 gCO2/kWh |
| 11:00 | 70 gCO2/kWh |
| 11:30 | 75 gCO2/kWh |
| 12:00 | 70 gCO2/kWh |
| 12:30 | 72 gCO2/kWh |
| 13:00 | 72 gCO2/kWh |
| 13:30 | 72 gCO2/kWh |
| 14:00 | 75 gCO2/kWh |
| 14:30 | 75 gCO2/kWh |
| 15:00 | 71 gCO2/kWh |
| 15:30 | 69 gCO2/kWh |
| 16:00 | 73 gCO2/kWh |
| 16:30 | 63 gCO2/kWh |
| 17:00 | 61 gCO2/kWh |
| 17:30 | 59 gCO2/kWh |
| 18:00 | 52 gCO2/kWh |
| 18:30 | 51 gCO2/kWh |
| 19:00 | 45 gCO2/kWh |
| 19:30 | 45 gCO2/kWh |
| 20:00 | 39 gCO2/kWh |
| 20:30 | 33 gCO2/kWh |
| 21:00 | 31 gCO2/kWh |
| 21:30 | 30 gCO2/kWh |
| 22:00 | 27 gCO2/kWh |
| 22:30 | 17 gCO2/kWh |
| 23:00 | 17 gCO2/kWh |
| 23:30 | 11 gCO2/kWh |
| 00:00 | 11 gCO2/kWh |
| 00:30 | 12 gCO2/kWh |
| 01:00 | 16 gCO2/kWh |
| 01:30 | 18 gCO2/kWh |
| 02:00 | 22 gCO2/kWh |
| 02:30 | 24 gCO2/kWh |
| 03:00 | 25 gCO2/kWh |
| 03:30 | 24 gCO2/kWh |
| 04:00 | 24 gCO2/kWh |
| 04:30 | 22 gCO2/kWh |
| 05:00 | 26 gCO2/kWh |
| 05:30 | 27 gCO2/kWh |
| 06:00 | 31 gCO2/kWh |
| 06:30 | 32 gCO2/kWh |
| 07:00 | 33 gCO2/kWh |
| 07:30 | 38 gCO2/kWh |
Community 1 card
Getting about
EV chargers, cycle parking and cash machines mapped by OpenStreetMap volunteers.
Charts 1 card
Sales across Sheffield by month
| Month | Sales | Median price |
|---|---|---|
| Nov 25 | 619 | £212,500 |
| Dec 25 | 578 | £208,750 |
| Jan 26 | 446 | £219,000 |
| Feb 26 | 506 | £220,000 |
| Mar 26 | 492 | £214,535 |
| Apr 26 | 382 | £215,000 |
| May 26 | 354 | £210,000 |
| Jun 26 | 358 | £215,000 |
| Jul 26 | 364 | £226,000 |
| Aug 26 | 104 | £200,000 |
Highest and lowest neighbourhood medians
| Neighbourhood | Median price | Sales |
|---|---|---|
| Whirlow | £658,000 | 16 sales |
| Parkhead | £610,000 | 9 sales |
| Dore | £587,500 | 38 sales |
| Fulwood | £545,000 | 26 sales |
| Ranmoor | £495,000 | 13 sales |
| Worral | £462,500 | 7 sales |
| Bents Green | £453,000 | 15 sales |
| Lodge Moor | £450,000 | 33 sales |
| Bradway | £425,000 | 39 sales |
| Totley | £425,000 | 65 sales |
| Cultural Industries Quarter | £108,500 | 8 sales |
| Netherthorpe | £108,000 | 15 sales |
| Cathedral Quarter | £107,250 | 12 sales |
| Devonshire Quarter | £106,000 | 7 sales |
| Firshill | £105,000 | 6 sales |
| Saint Vincent's and Shalesmoor | £88,975 | 12 sales |
| Tinsley | £84,000 | 16 sales |
| Wicker | £84,000 | 7 sales |
| Page Hall | £78,500 | 12 sales |
| Osgathorpe | £72,500 | 8 sales |
Source: Office for National Statistics licensed under the Open Government Licence v.3.0. Census 2021 tables via Nomis; population-weighted centroids from ONS Open Geography, contains OS data © Crown copyright and database right 2026. Contains HM Land Registry data © Crown copyright and database right 2026. This data is licensed under the Open Government Licence v3.0. All data sources
More 4 cards
Recorded crime in Sheffield, August 2026
South Yorkshire Police recorded 7,501 offences across the city in August 2026, the most recent whole month the Home Office has published. Crime data comes out about two months in arrears, so this is not a picture of today.
These are counts for a neighbourhood, not for a street or a home. The locations the Home Office publishes are anonymous map points that stand for a stretch of street, so no figure here says where anything happened, and none of them is stored on this site.
| Offence type | Recorded | Share of all crime |
|---|---|---|
| Violence and sexual offences | 2,448 | 32.6% |
| Anti-social behaviour | 1,317 | 17.6% |
| Shoplifting | 1,002 | 13.4% |
| Criminal damage and arson | 570 | 7.6% |
| Public order | 530 | 7.1% |
| Other theft | 366 | 4.9% |
| Vehicle crime | 363 | 4.8% |
| Burglary | 279 | 3.7% |
| Neighbourhood | Offences recorded | Most recorded type |
|---|---|---|
| City Centre | 249 | Violence and sexual offences |
| Cathedral Quarter | 136 | Violence and sexual offences |
| Woodhouse | 132 | Violence and sexual offences |
| Darnall | 115 | Violence and sexual offences |
| The Moor | 110 | Shoplifting |
| Hillsborough | 109 | Violence and sexual offences |
| Southey | 109 | Violence and sexual offences |
| Tinsley | 105 | Violence and sexual offences |
A busy city-centre neighbourhood records more offences than a quiet residential one partly because far more people are in it. These are counts, not rates, and they are not a ranking of how safe anywhere is to live.
1,700 offences fell outside every neighbourhood boundary and are counted in the city total only.
Recorded crime by neighbourhood on the map · The force's own crime map
What people are reporting to the council
1,604 problems were reported to Sheffield City Council through FixMyStreet in the last 30 days, across 138 neighbourhoods.
These are reports, not findings. Somebody saw something and told the council about it through FixMyStreet. A report can be mistaken, a duplicate of another, or already dealt with, and the status beside it is the status FixMyStreet holds rather than a statement about the street today.
| What was reported | Reports in 30 days | Share |
|---|---|---|
| Fly tipping and rubbish | 692 | 43.1% |
| Parking and vehicles | 400 | 24.9% |
| Roads and potholes | 163 | 10.2% |
| Trees, parks and grass | 116 | 7.2% |
| Something else | 90 | 5.6% |
| Pavements and paths | 85 | 5.3% |
| Graffiti and damage | 31 | 1.9% |
| Street lighting | 19 | 1.2% |
| Signs, bins and street furniture | 8 | 0.5% |
FixMyStreet answers with the newest 1,000 reports and no more, so the figures above are at least that many rather than the exact total.
Of the 2,000 reports held here, 1,938 are still marked open on FixMyStreet (97%) and 0 are marked fixed. A report stays open until somebody marks it otherwise, so an open report is not proof that nothing was done, and a report whose status changed after it dropped out of the feed still reads as it did then.
Reported problems on the map · Report something, or read the reports on FixMyStreet
Official monthly data
Sheffield house-price context
July 2026
- Average price
- £219,713
- First-time buyer
- £194,060
- Annual change
- 2.8%
- Monthly change
- 0.2%
UK House Price Index. Contains HM Land Registry data © Crown copyright and database right, covering completed Sheffield sales. The index is HM Land Registry’s mix-adjusted monthly estimate for the whole city; the sold-price block is the median of actual registered sales over twelve months, so the two figures measure different things. Current rental and asking-price sources will appear separately.